
This complete adaptation of GNU MCU Eclipse OpenOCD V2.0.0 (RK-KF-YF-91) retains all six technical chapters, commands, logs, examples and 53 technical screenshots. Only the Chinese PDF (41 pages) was supplied. English and Russian are full translations; all languages use the Chinese PDF’s original figures with localized captions and alt text. Comments in source code, commands and logs are retained. No English original figures are claimed.
This is a platform reference for an older Rockchip-customized debugging tool. The source lists RK3588, RK3568, RK3566, RK3399, RK3288, RK3368, RK3326, PX30, RK3308, RV1108, RV1126/RV1109/RV1106, RK2108, RK2206 and RISCV, but leaves the kernel-version column blank. This does not establish compatibility with every current BSP or ArmSoM board. Even for RK3588 on ArmSoM Sige7, verify JTAG/SWD routing, IOMUX, voltage levels, adapter, chip scripts, symbols, SDK/BSP and kernel version. No ArmSoM hardware validation has been performed.
Source product-version table (blank kernel versions are retained):
| Chip | Kernel version |
|---|---|
| RK3588 | |
| RK3568 | |
| RK3566 | |
| RK3399 | |
| RK3288 | |
| RK3368 | |
| RK3326 | |
| PX30 | |
| RK3308 | |
| RV1108 | |
| RV1126/RV1109/RV1106 | |
| RK2108 | |
| RK2206 | |
| RISCV |
Note: software versions, package sources and paths below belong to the source environment, not current installation recommendations. Debugging can halt CPUs, modify memory and trigger KGDB. Use only authorized, recoverable test devices. None of these commands was executed for this article; source timings, logs and failures are not ArmSoM measurements.
1. Overview
The debugging architecture is Eclipse CDT + GNU MCU Eclipse OpenOCD + Eclipse + GDB + OpenOCD + ftdi/jlink + SoC. CDT is C/C++ Development Tooling. GNU MCU Eclipse OpenOCD is an open-source plugin connecting CDT with GDB and OpenOCD. Eclipse integrates plugins; ARM DS-5 is also based on Eclipse. GDB is the GNU debugger. OpenOCD supports SWD/JTAG adapters and architectures including ARM and RISCV. The source uses an FT232H USB-to-SWD/JTAG adapter and describes it as fast and stable.
2. Operating-system environment
2.1 Windows
2.1.1 Package openocd_eclipse.zip
Extract the archive, enter its root directory and run Eclipse_for_OpenOCD V1.0.exe. In the RK directory, eclipse-workspace is the preconfigured workspace; example contains examples; tools contains GDB, JDK and related tools; 实战视频 contains quick-start videos; OpenOCD contains OpenOCD files; SVD (CMSIS System View Description format) supports register viewing; and doc contains help documents.
2.1.2 Installing JRE
Eclipse requires JRE; the source installer is RK\tools\jdk_8.0.1310.11_64.exe.
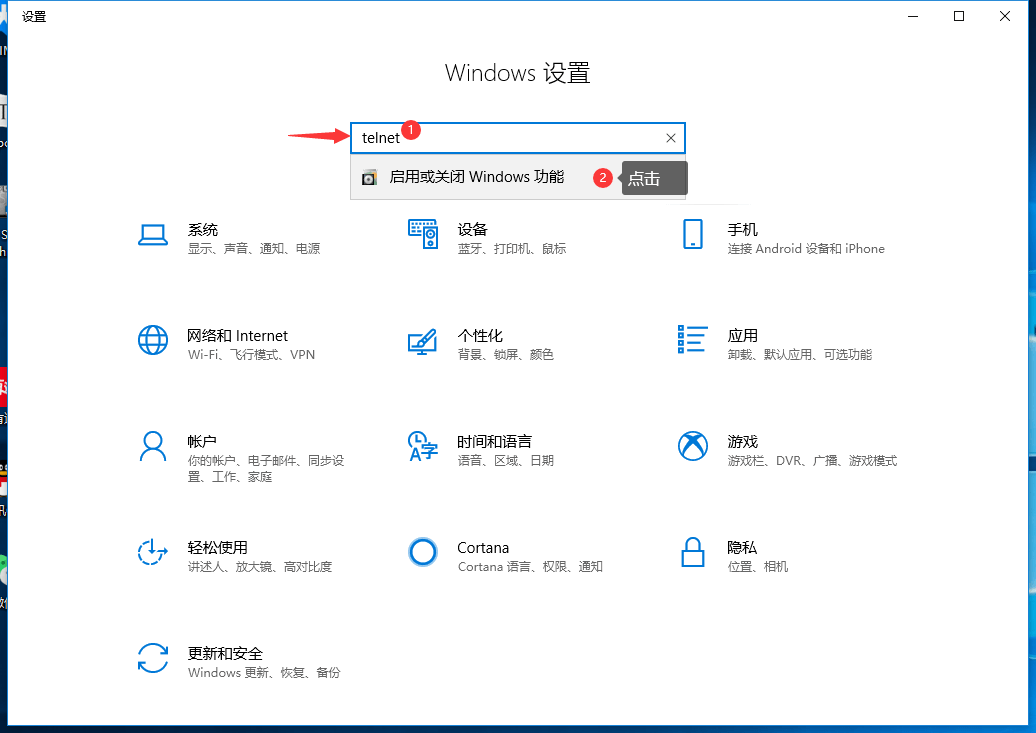
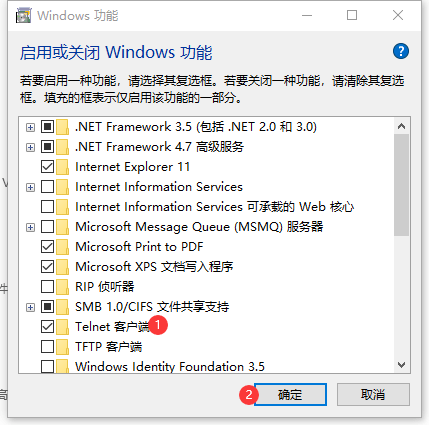
2.1.3 Enabling Windows Telnet
Telnet provides access to OpenOCD command mode. The location varies by Windows version; the source screenshots illustrate Windows 10.
2.2 64-bit Ubuntu
2.2.1 Package openocd_eclipse.tar.gz
tar -xzvf openocd_eclipse.tar.gz
Enter the extracted root directory and execute eclipse. RK contains the default eclipse-workspace, example, OpenOCD, register descriptions in SVD, tools such as GDB in tools, help in doc and quick-start videos in 实战视频.
2.2.2 Installing dependencies
Eclipse requires JRE; the source notes that version 8 is not mandatory:
 sudo add-apt-repository ppa:openjdk-r/ppa
 sudo apt-get update
 sudo apt-get install openjdk-8-jre 这⾥不⼀定要8
OpenOCD requires libusb and libftdi:
 sudo apt-get install libusb-1.0-0-dev
 sudo apt-get install libftdi-dev
Copy the USB device rules:
 sudo cp RK/OpenOCD/drivers/99-openocd.rules /etc/udev/rules.d/
 sudo cp RK/OpenOCD/drivers/60-openocd.rules /etc/udev/rules.d/
Install the open-source Capstone disassembly tool. The source reports successful tests on Ubuntu 16.04 and 18.04; these are not tests of a current system or ArmSoM hardware.
sudo apt-get install libcapstone-dev
3. Quick start
The Ubuntu and Windows UIs are essentially the same; the source mainly demonstrates Windows.
3.1 Hardware connections
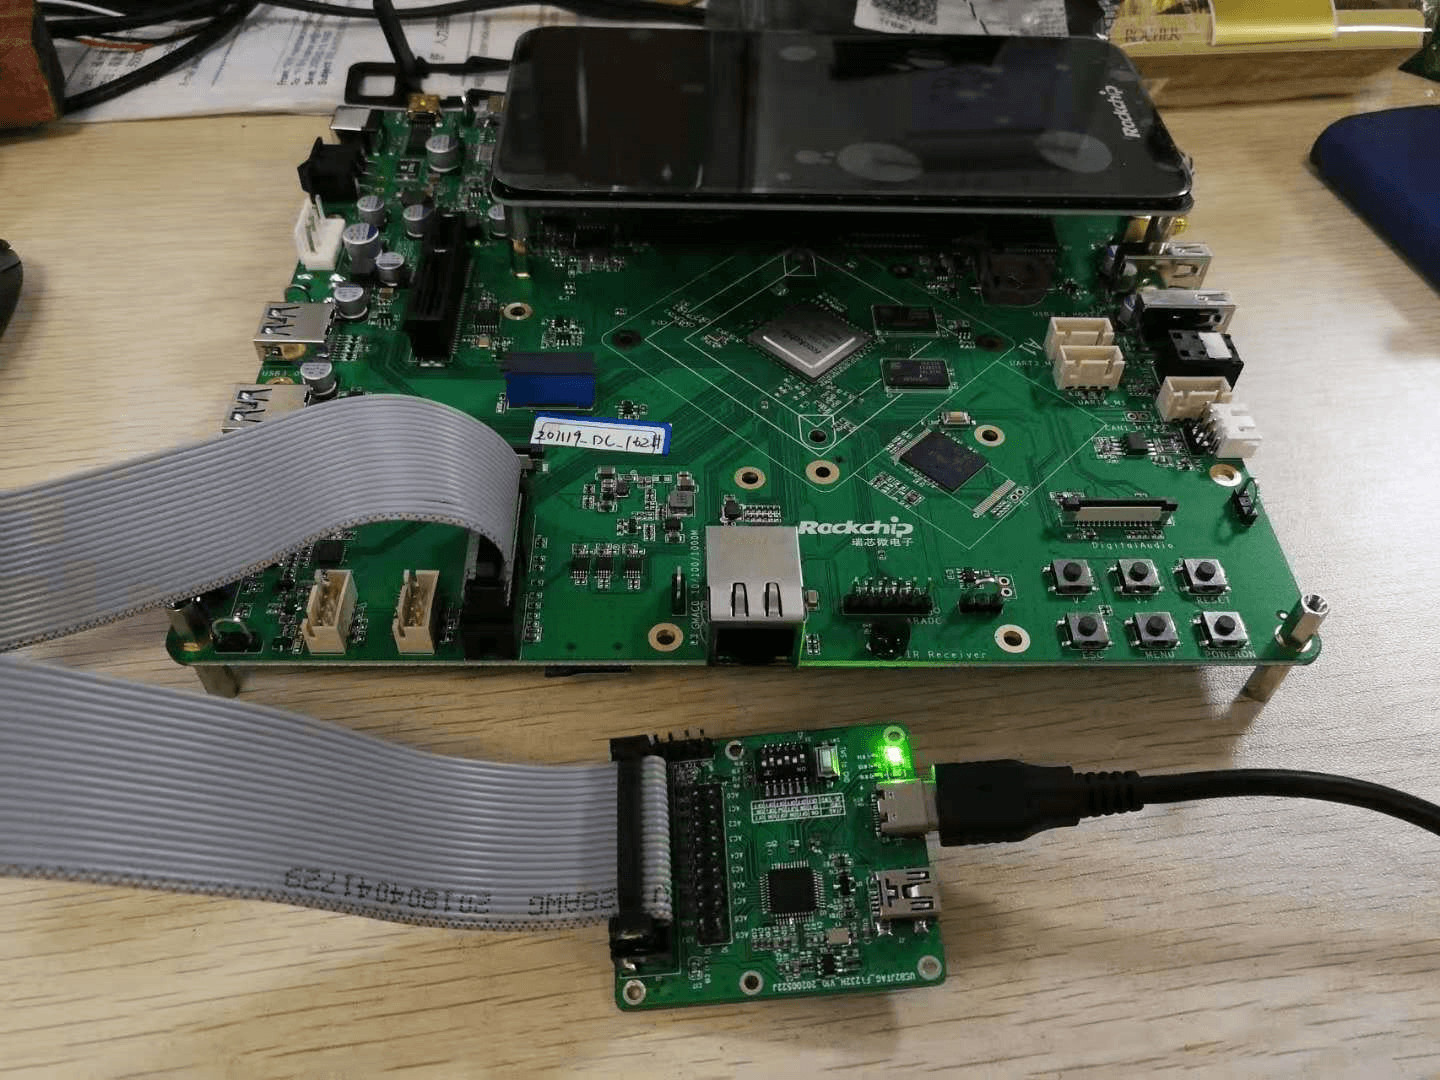
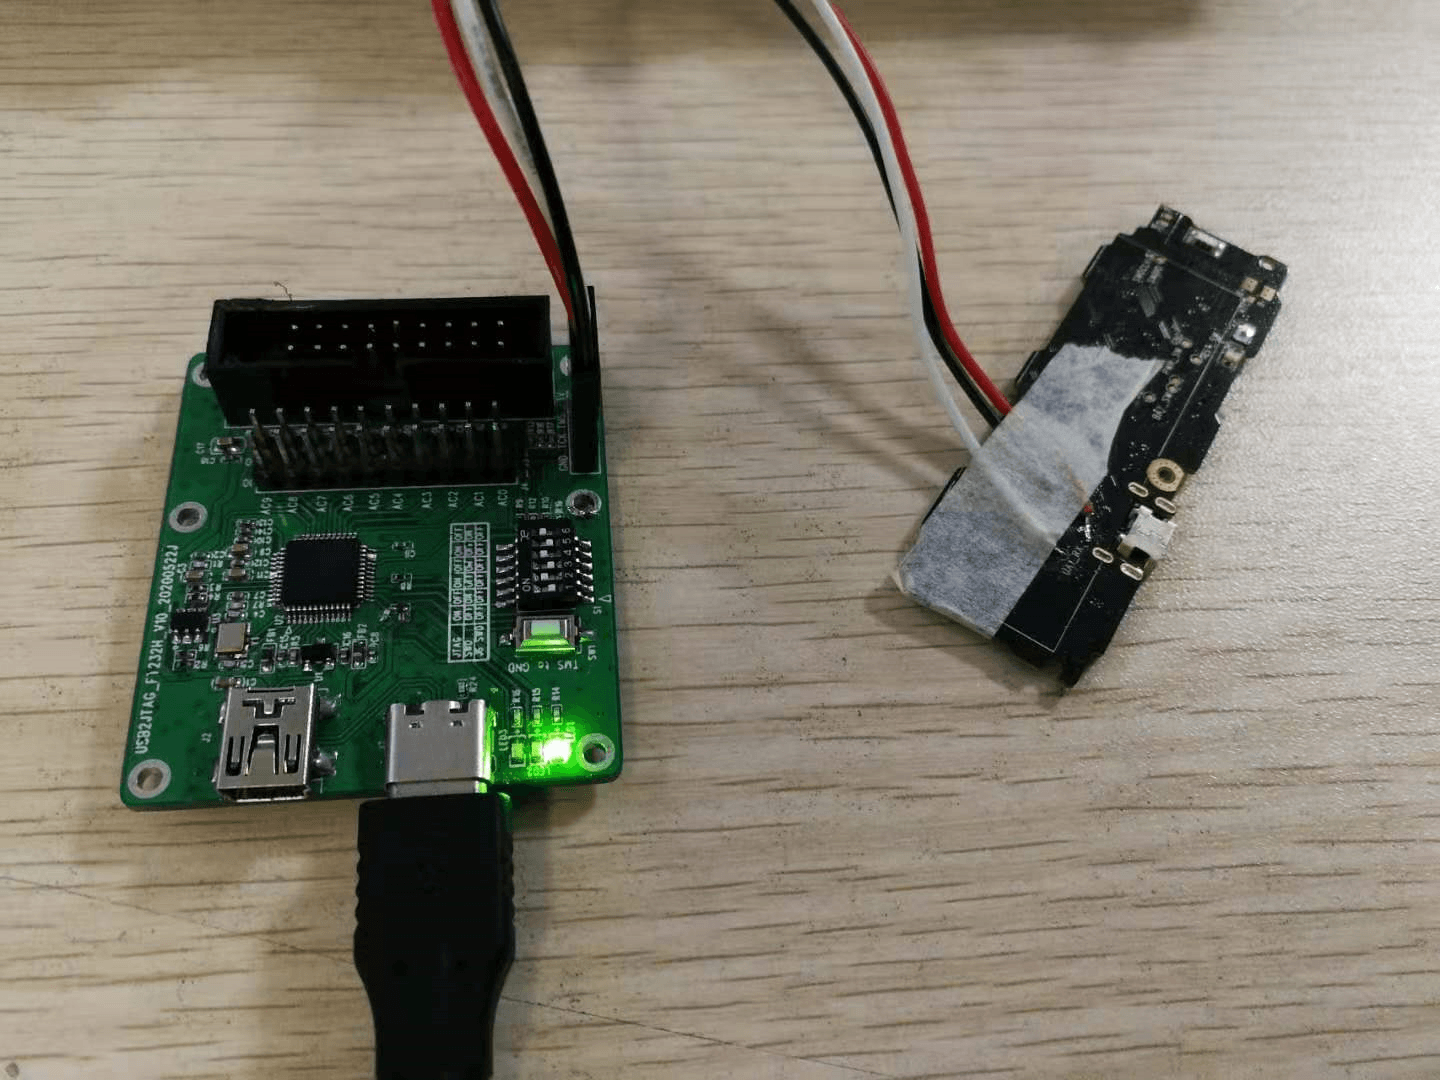
3.1.1 Standard ARM 20-pin JTAG header
3.1.2 TF-to-JTAG adapter board
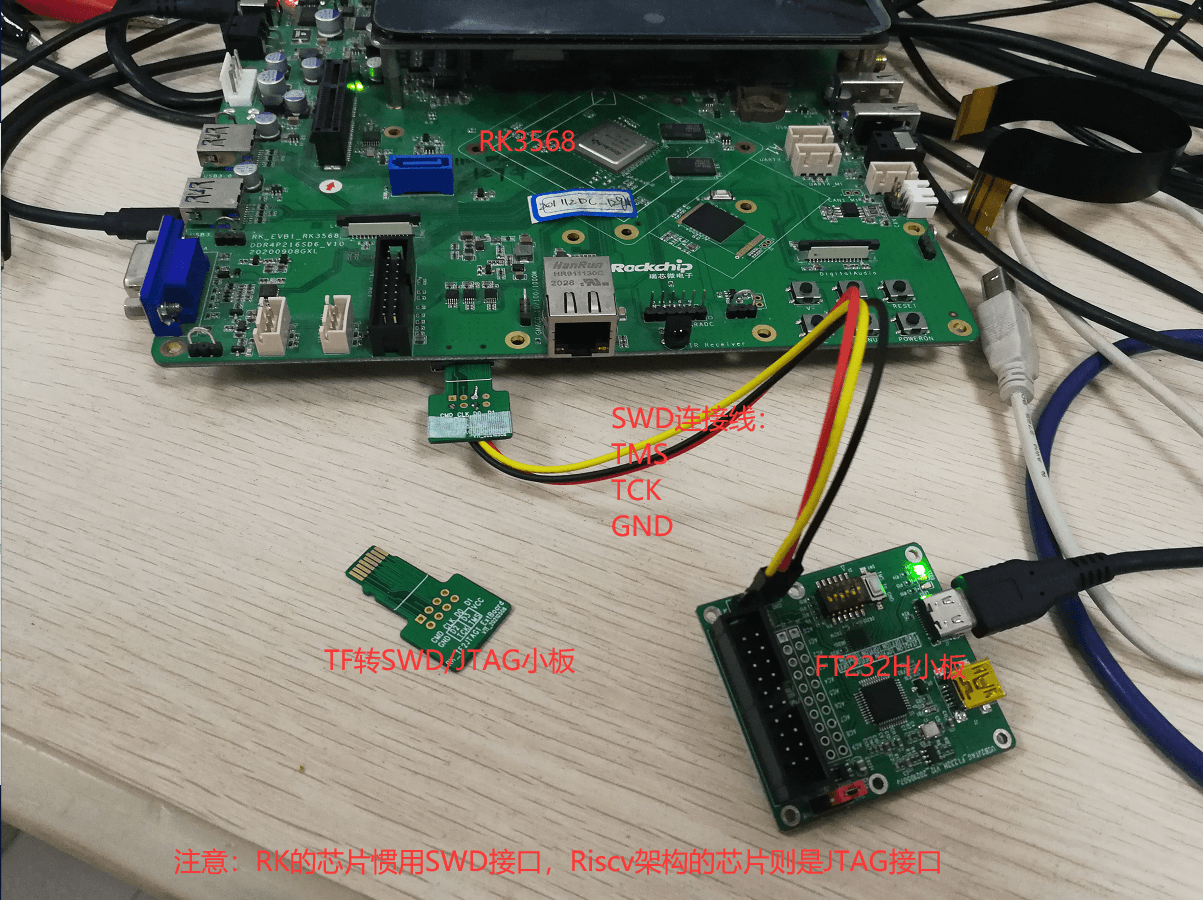
The source wiring image labels TMS, TCK and GND and notes SWD for RK-architecture chips and JTAG for RISC-V chips. This describes the pictured tool/chip setup and does not replace checking the target board schematic.
3.1.3 UART2/JTAG multiplexing
3.2 Software connection
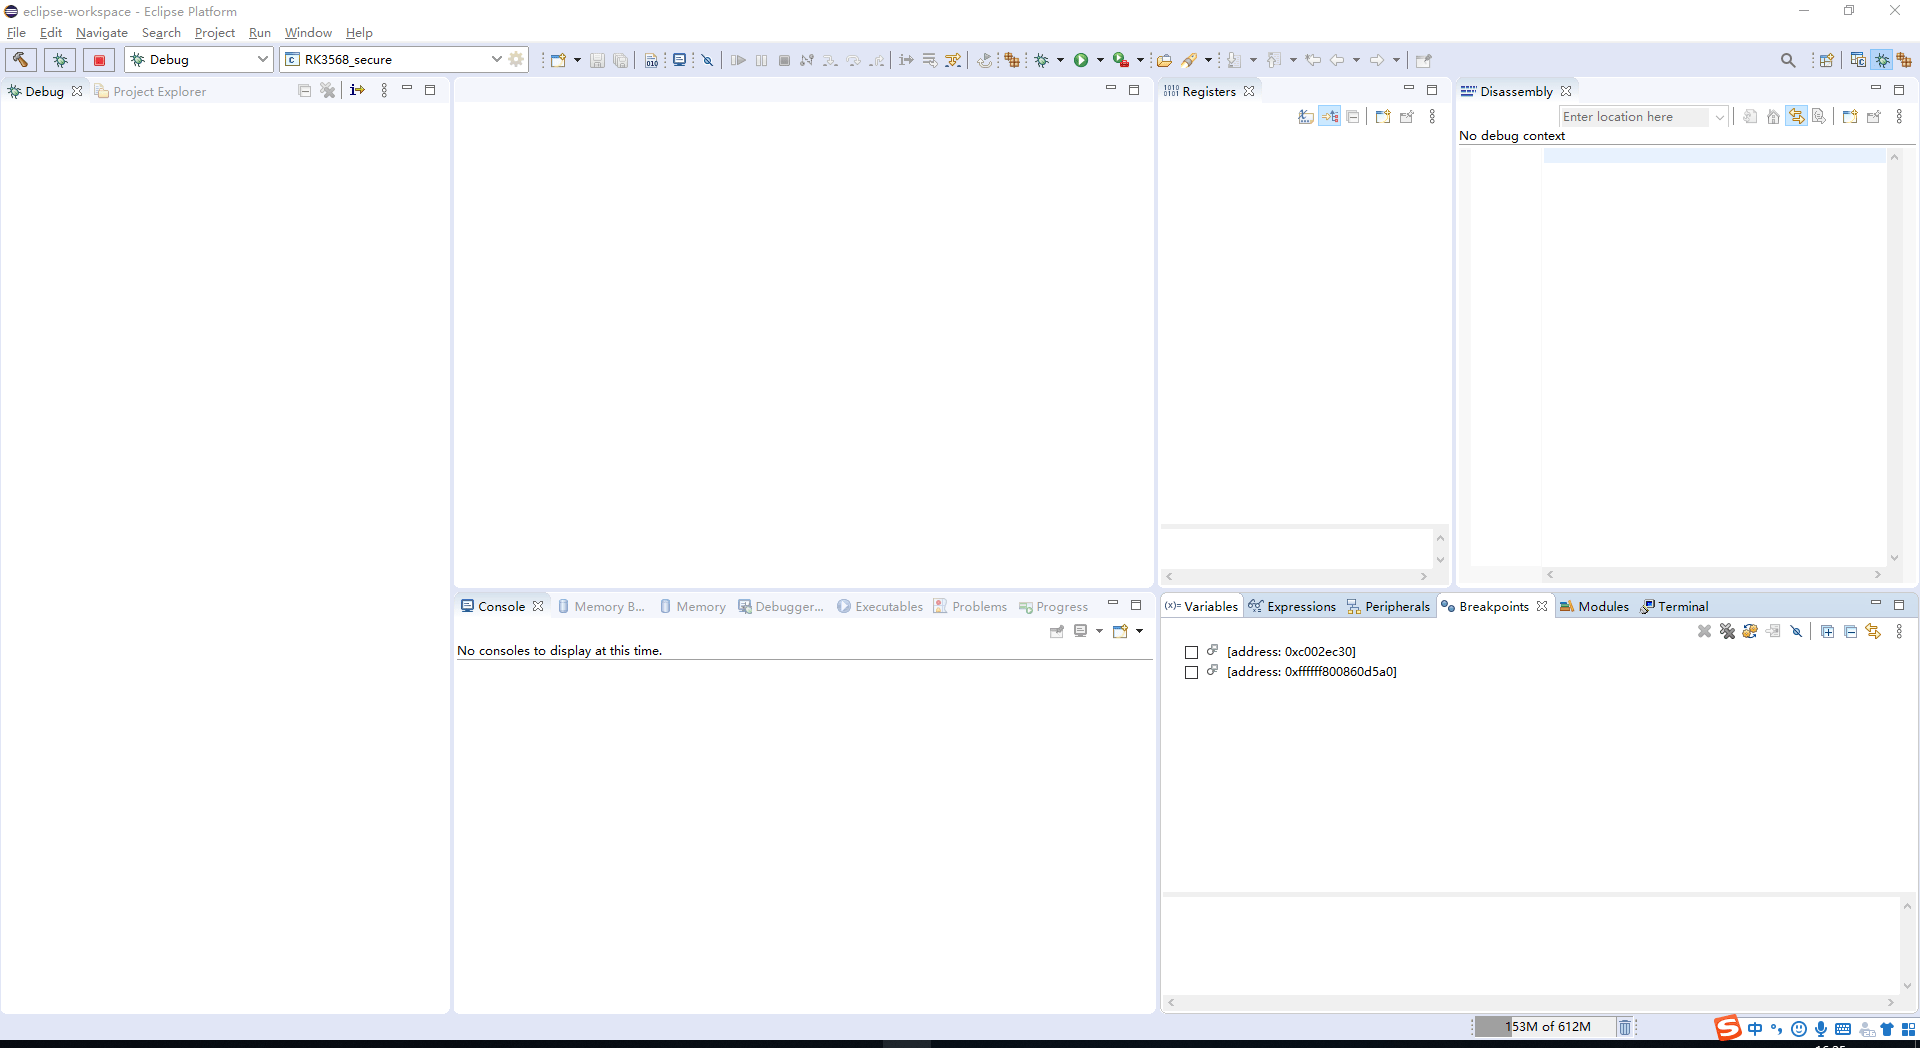
3.2.1 Running the launcher
Run Eclipse_for_OpenOCD V1.0.exe.
3.2.2 Importing chip configurations (optional)
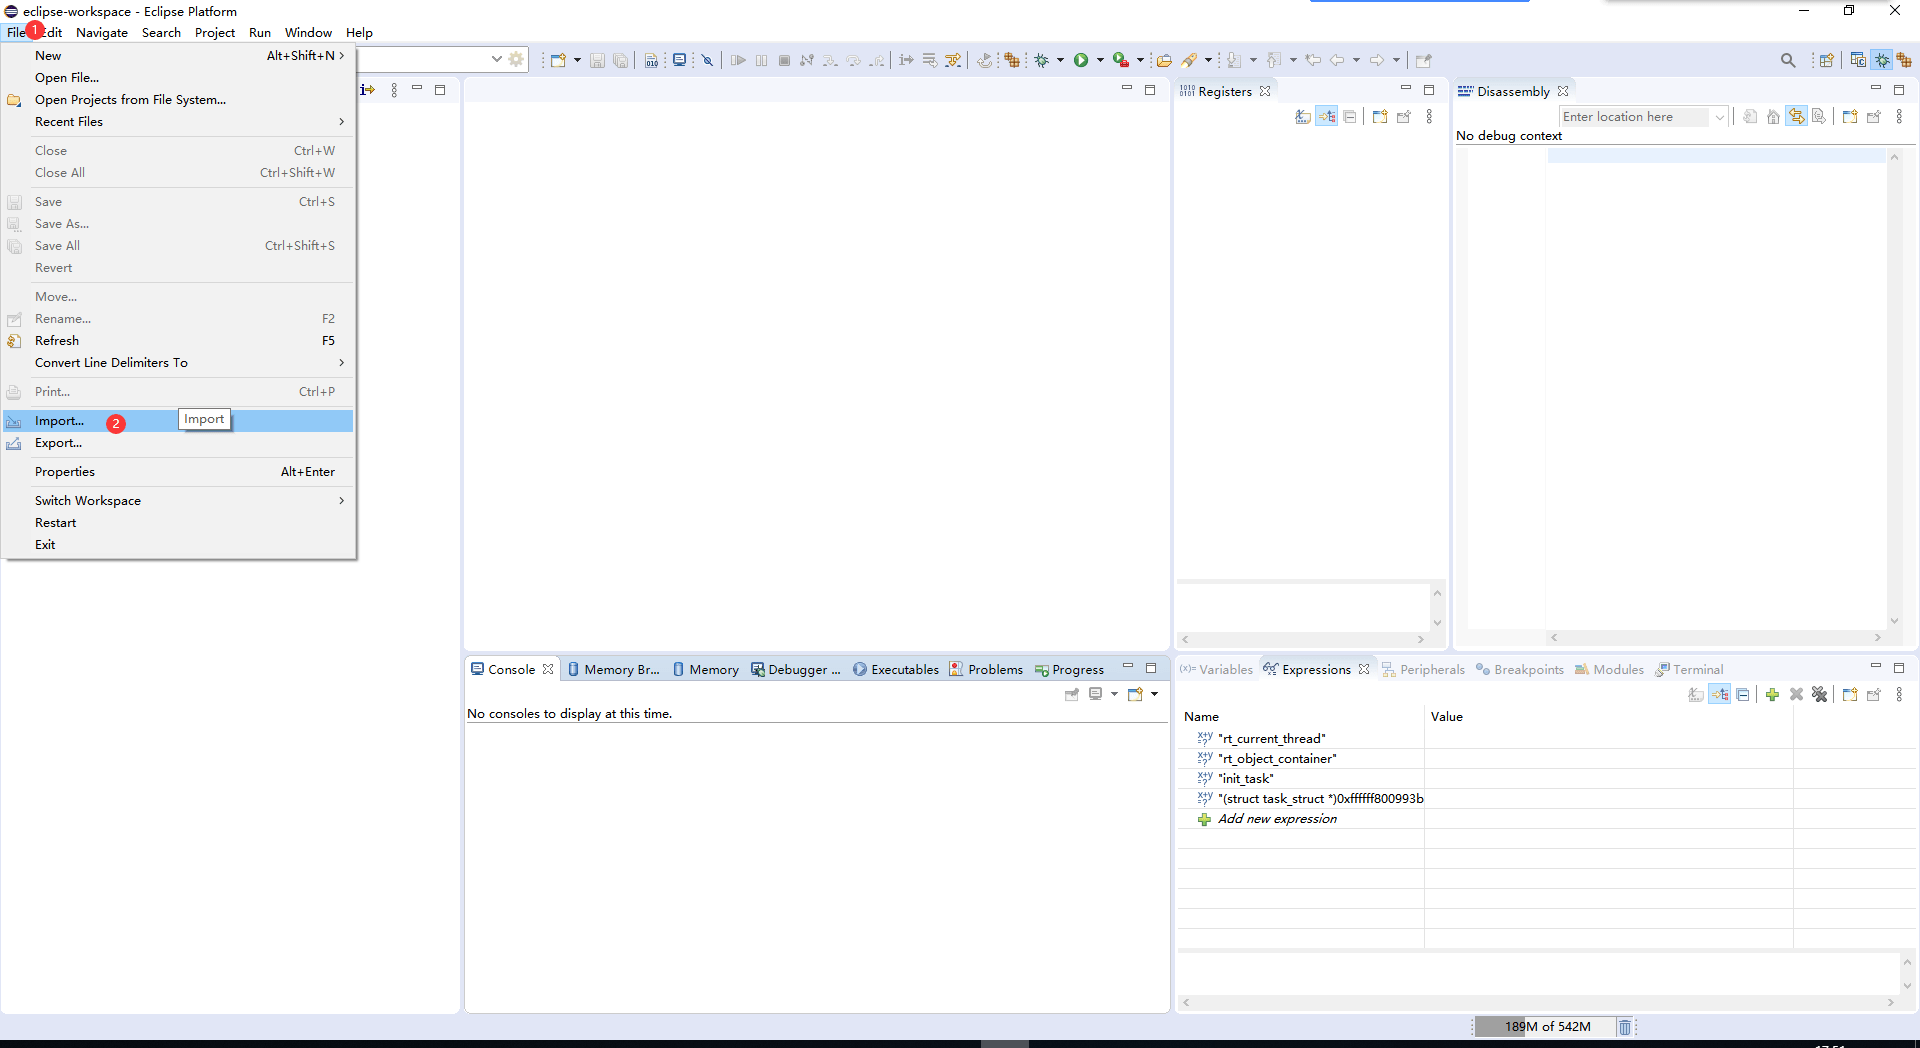
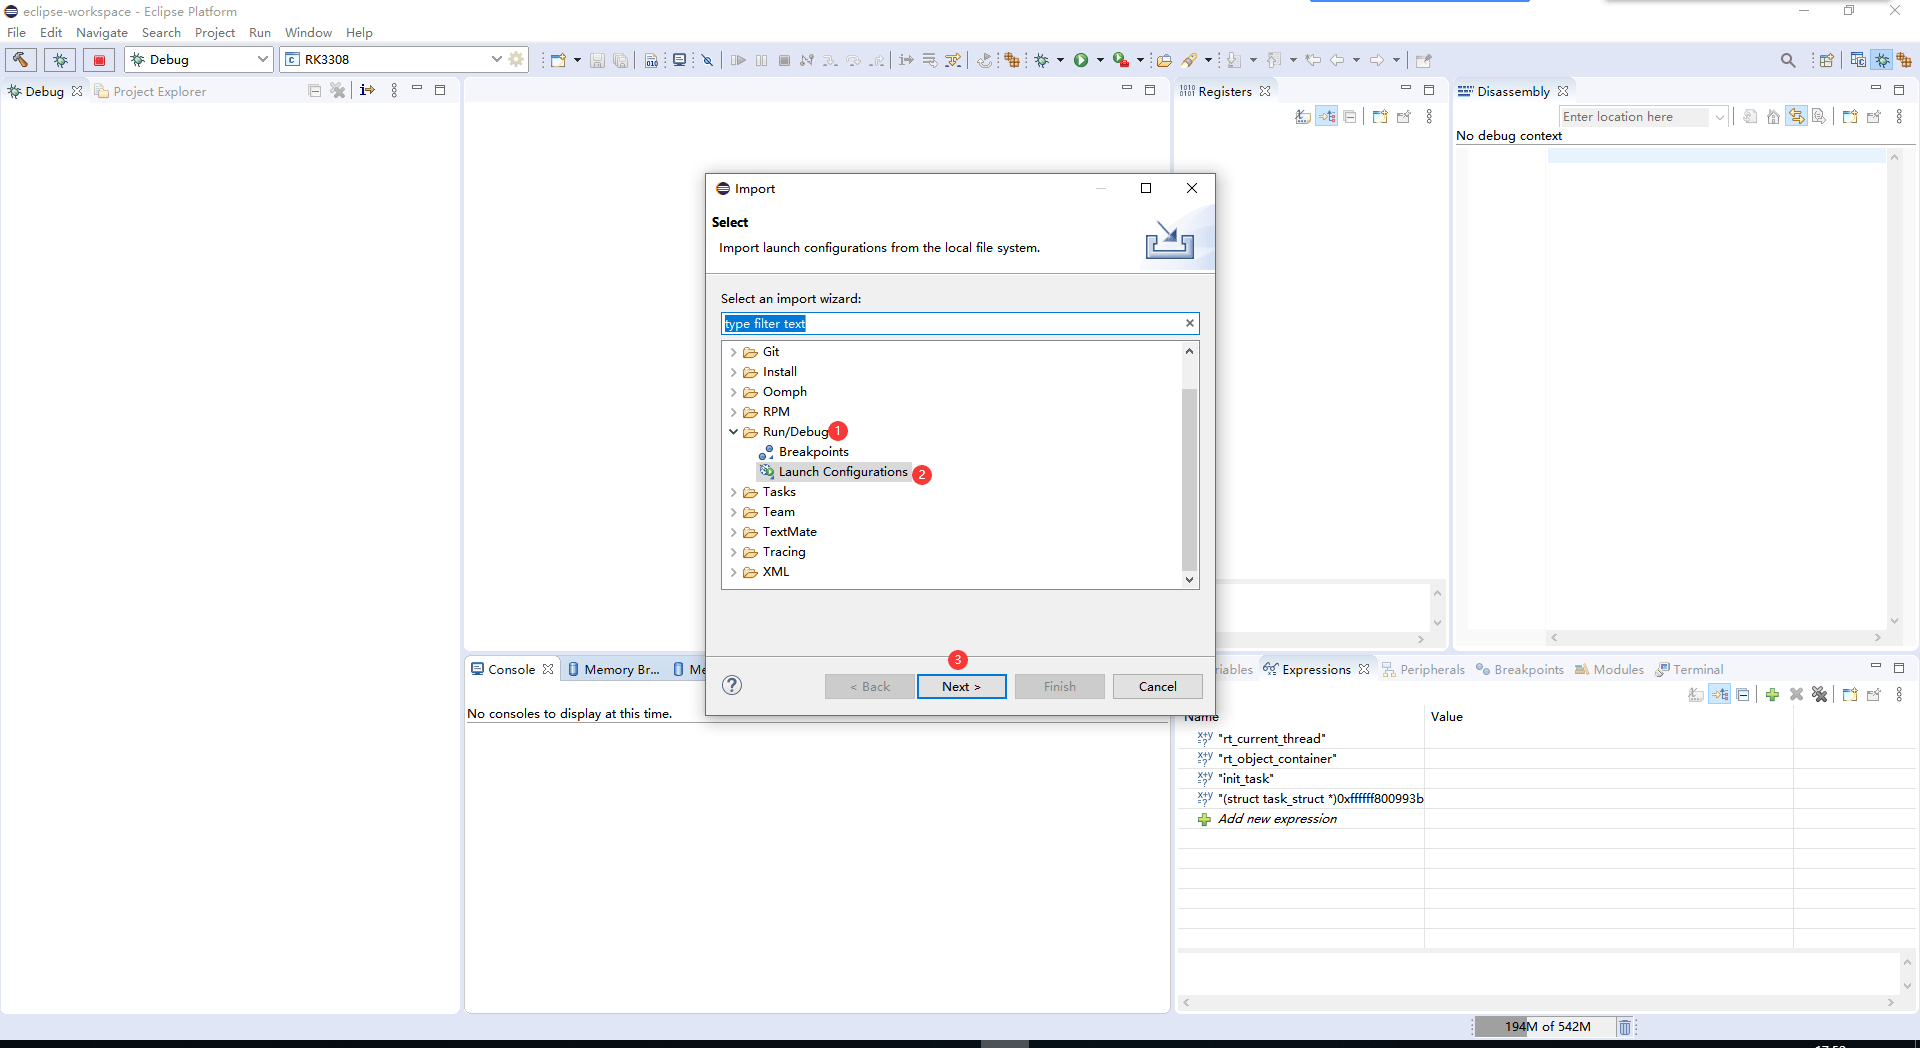
The normal package already contains chip configurations. Import them as shown when configurations are updated, changed or added.
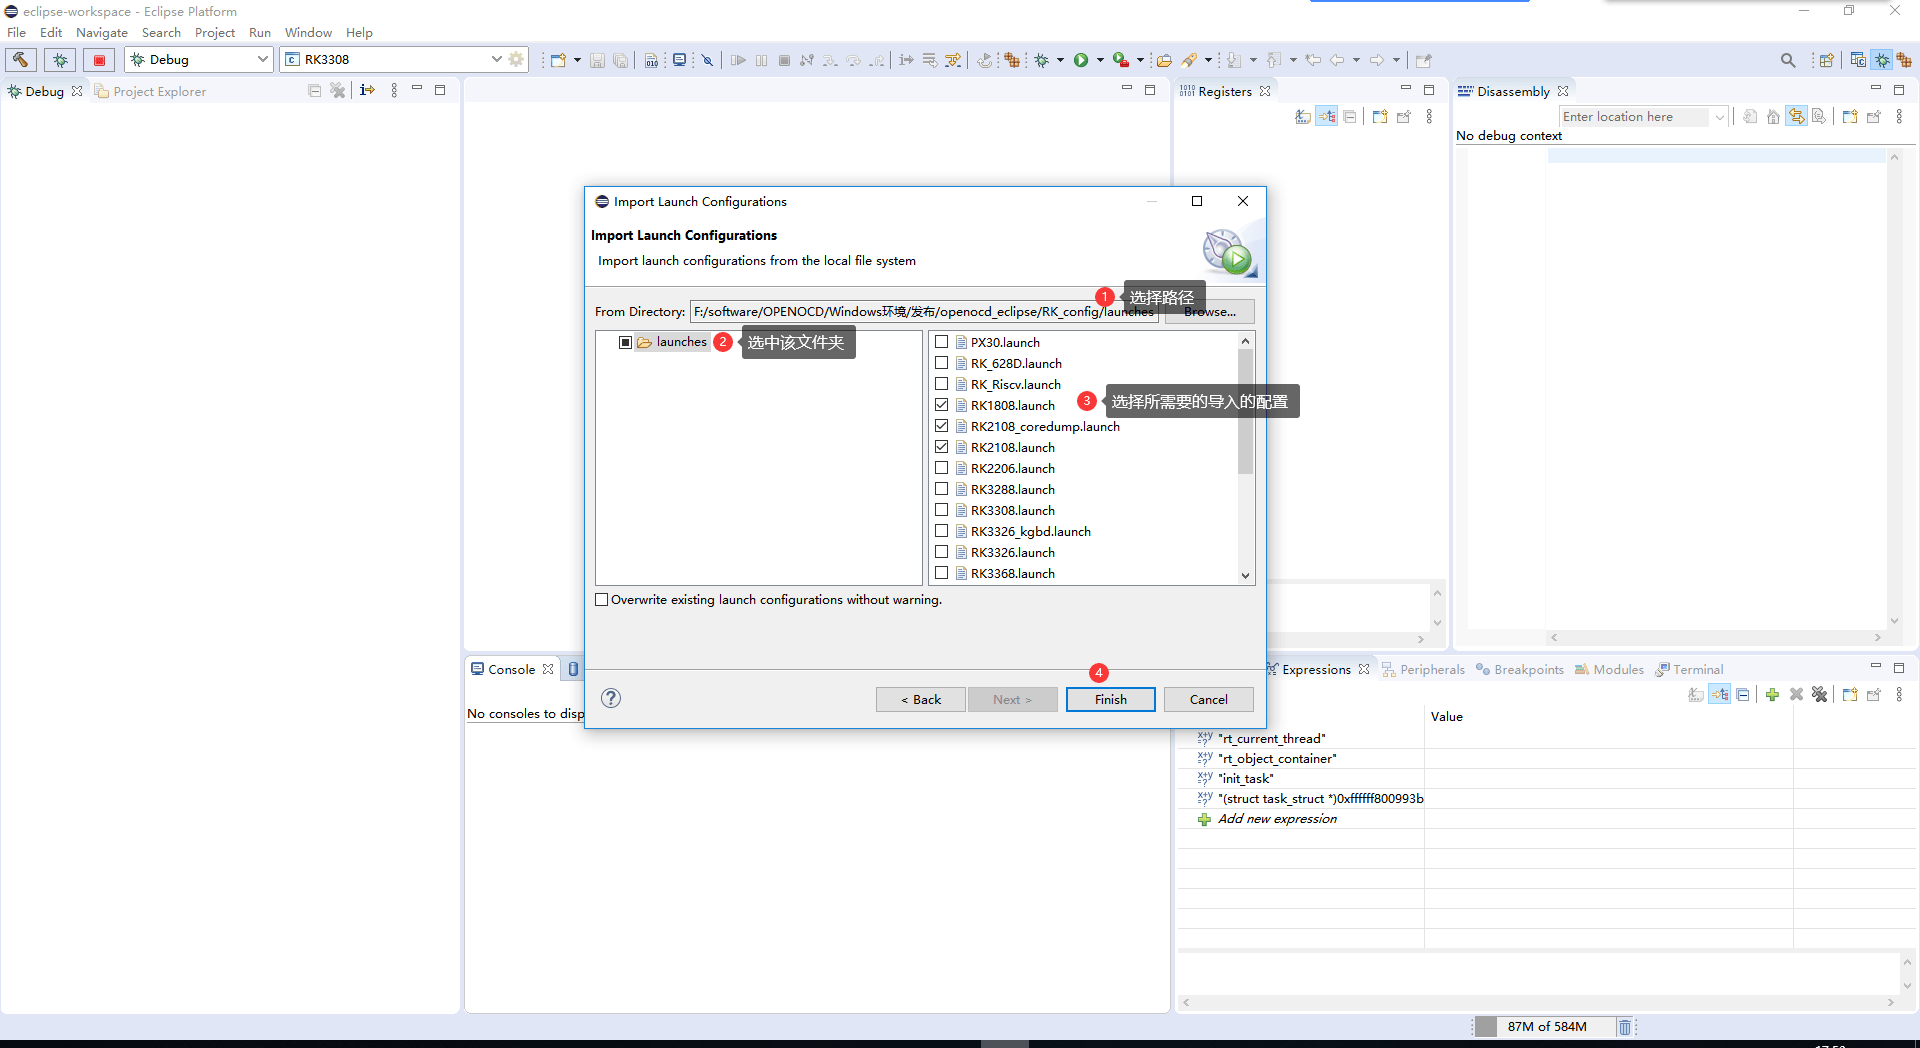
3.2.3 Selecting the target chip
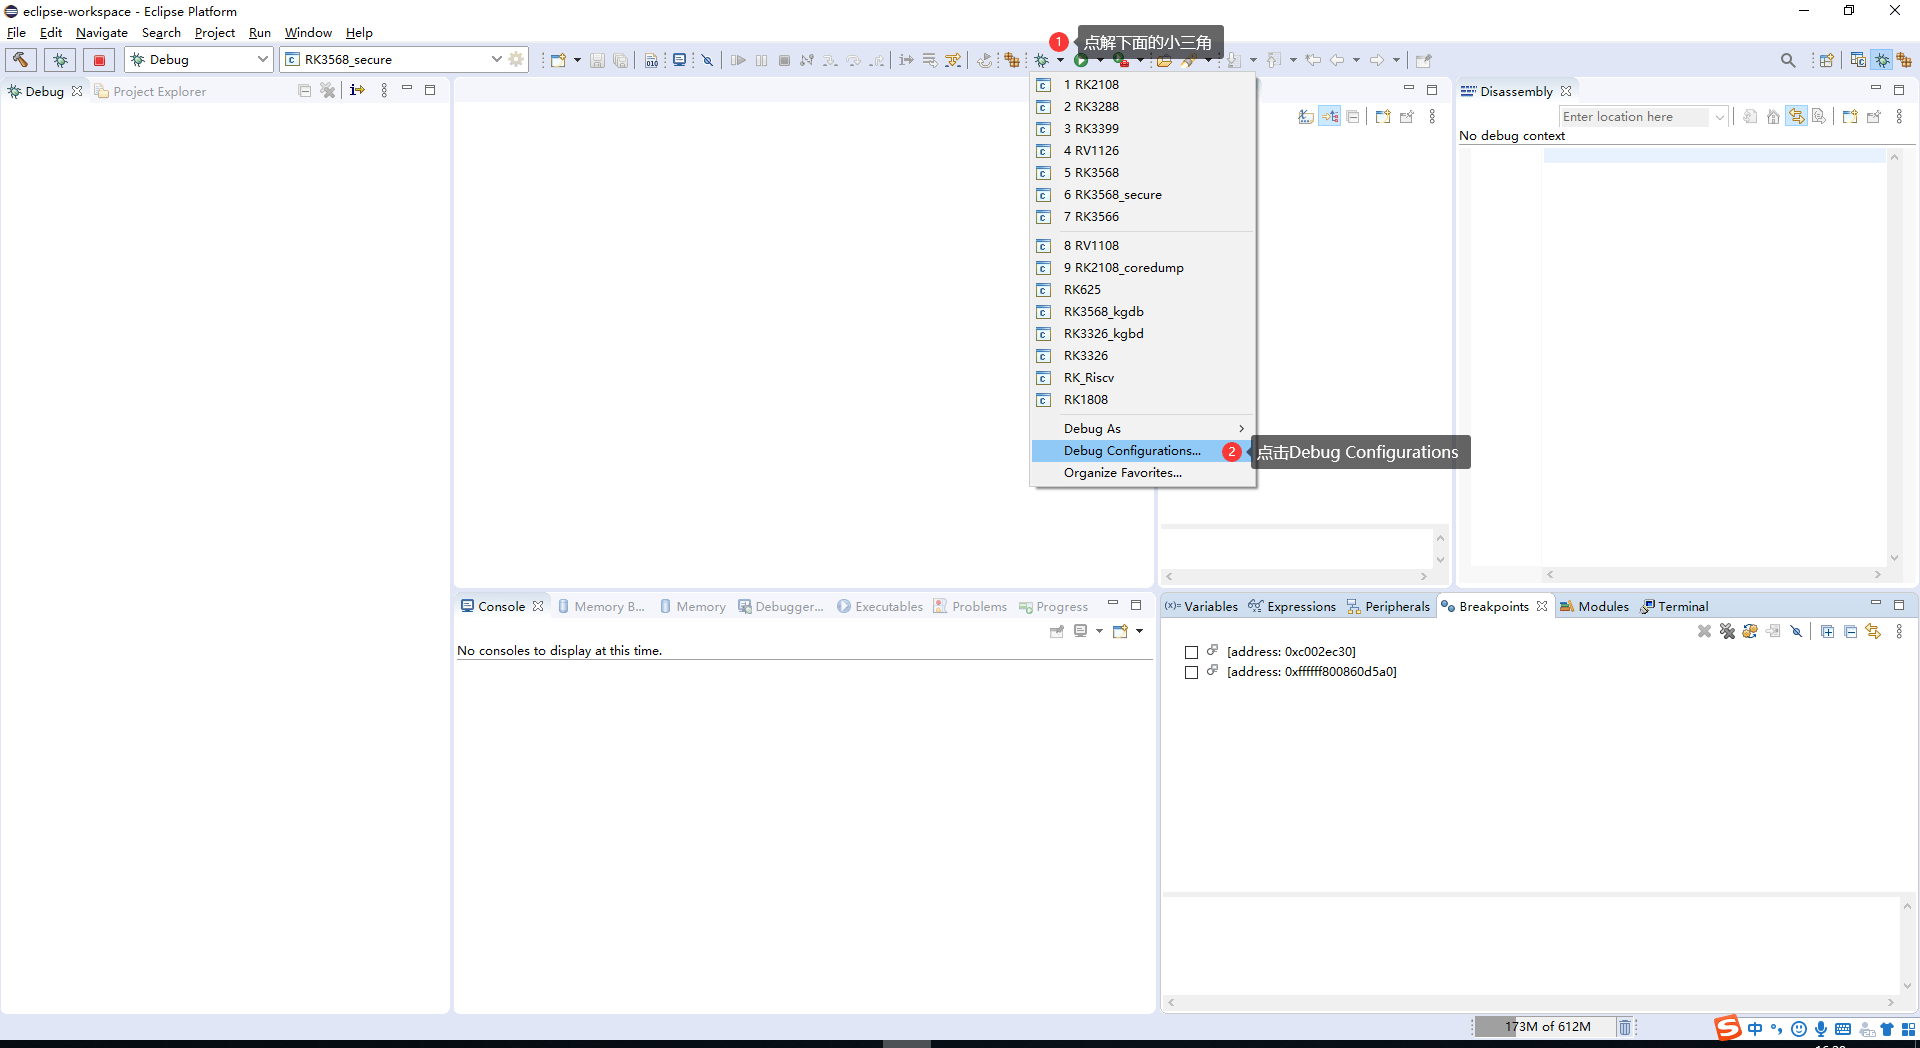
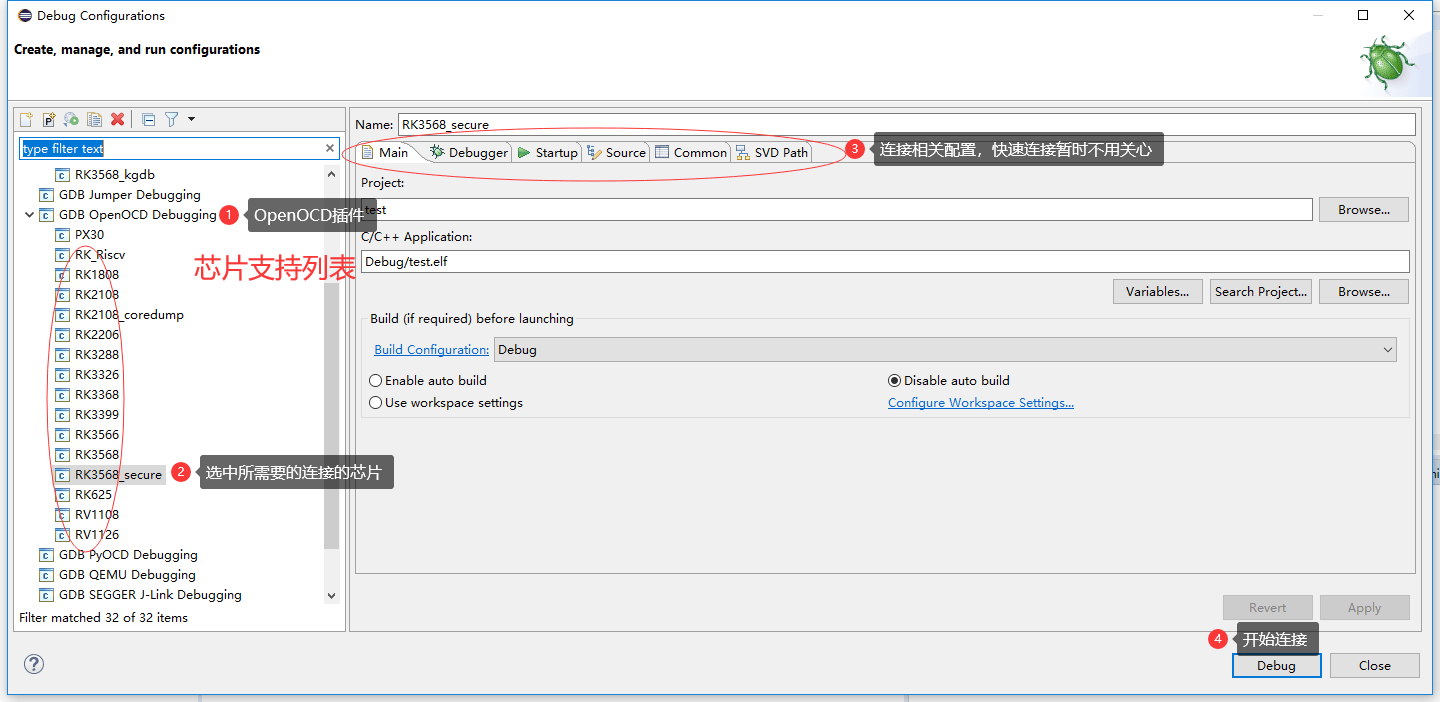
3.2.4 Successful connection
The following shows a successful connection after stopping the CPU.
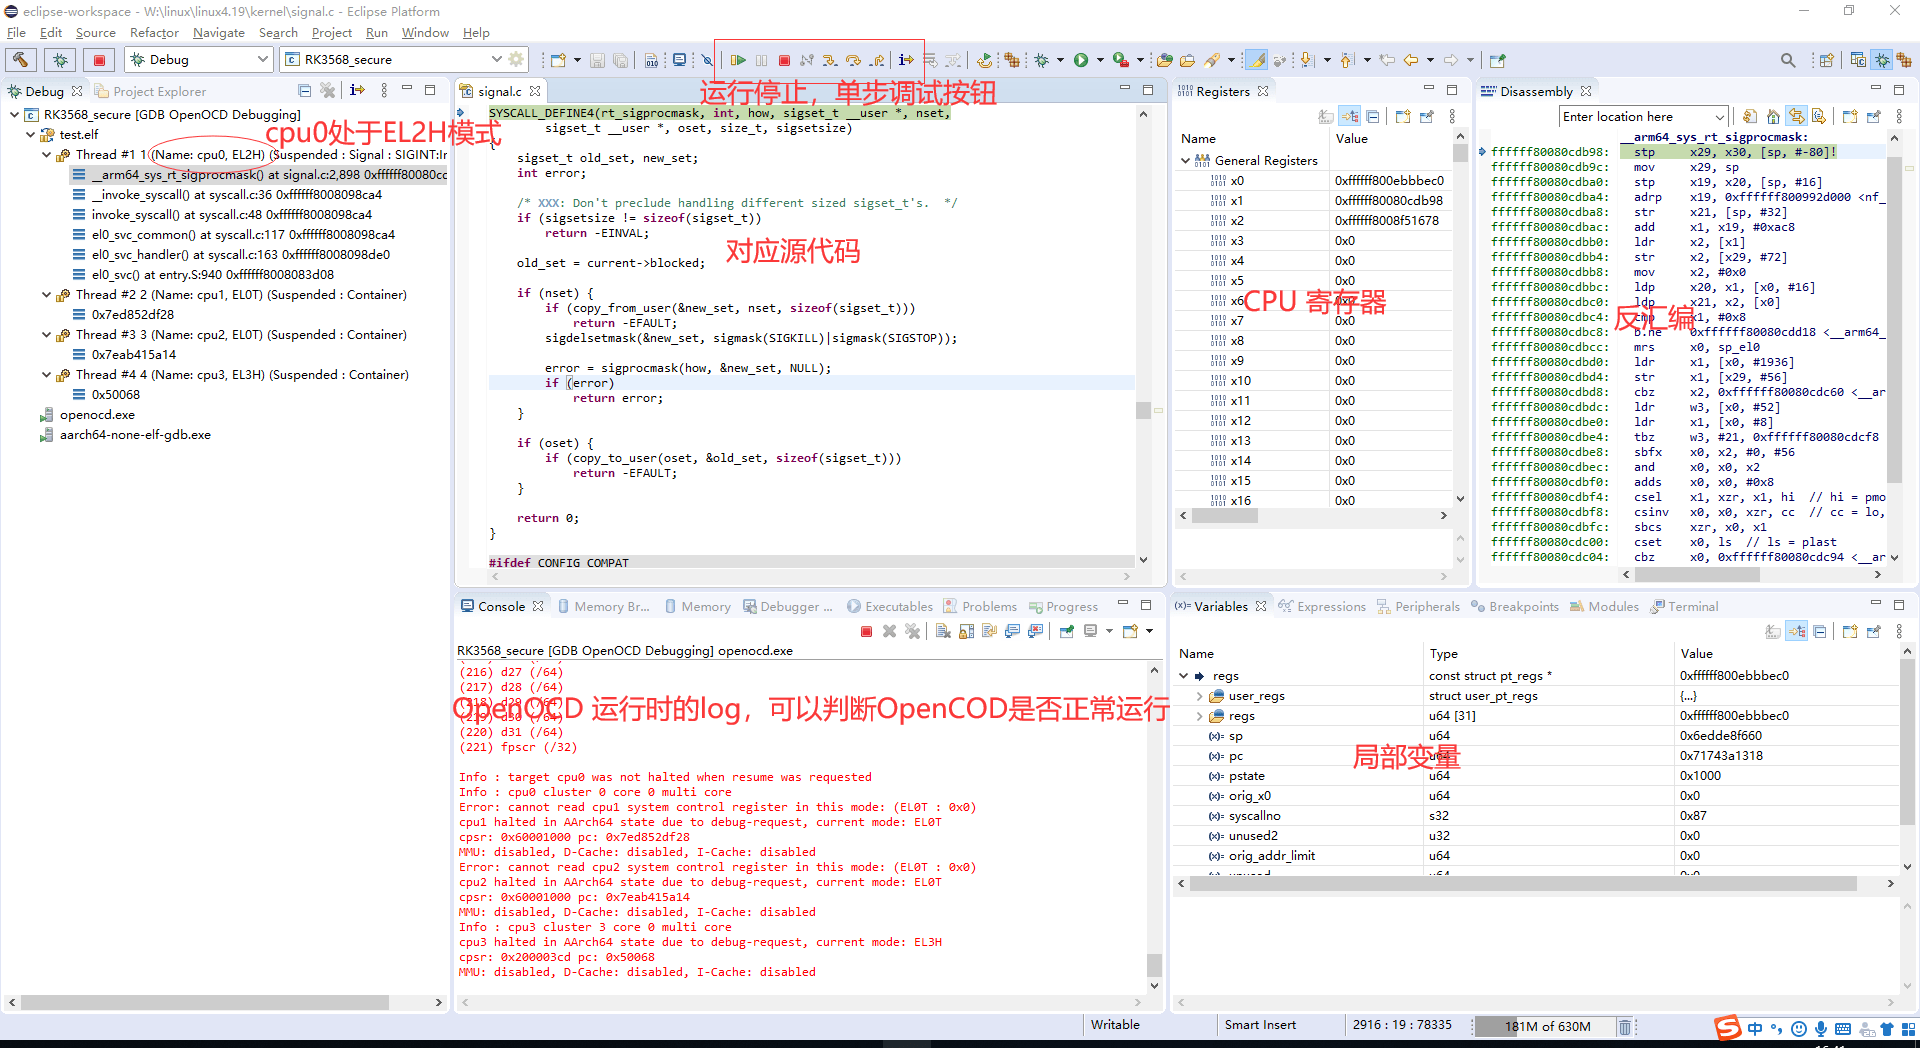
3.2.5 Connection failures
3.2.5.1 JTAG adapter not detected
Check the adapter driver and hardware. See Rockchip_Developer_Guide_FT232H_USB2JTAG.pdf. The source OpenOCD build automatically detects FT232H, FT2232H and J-Link adapters.
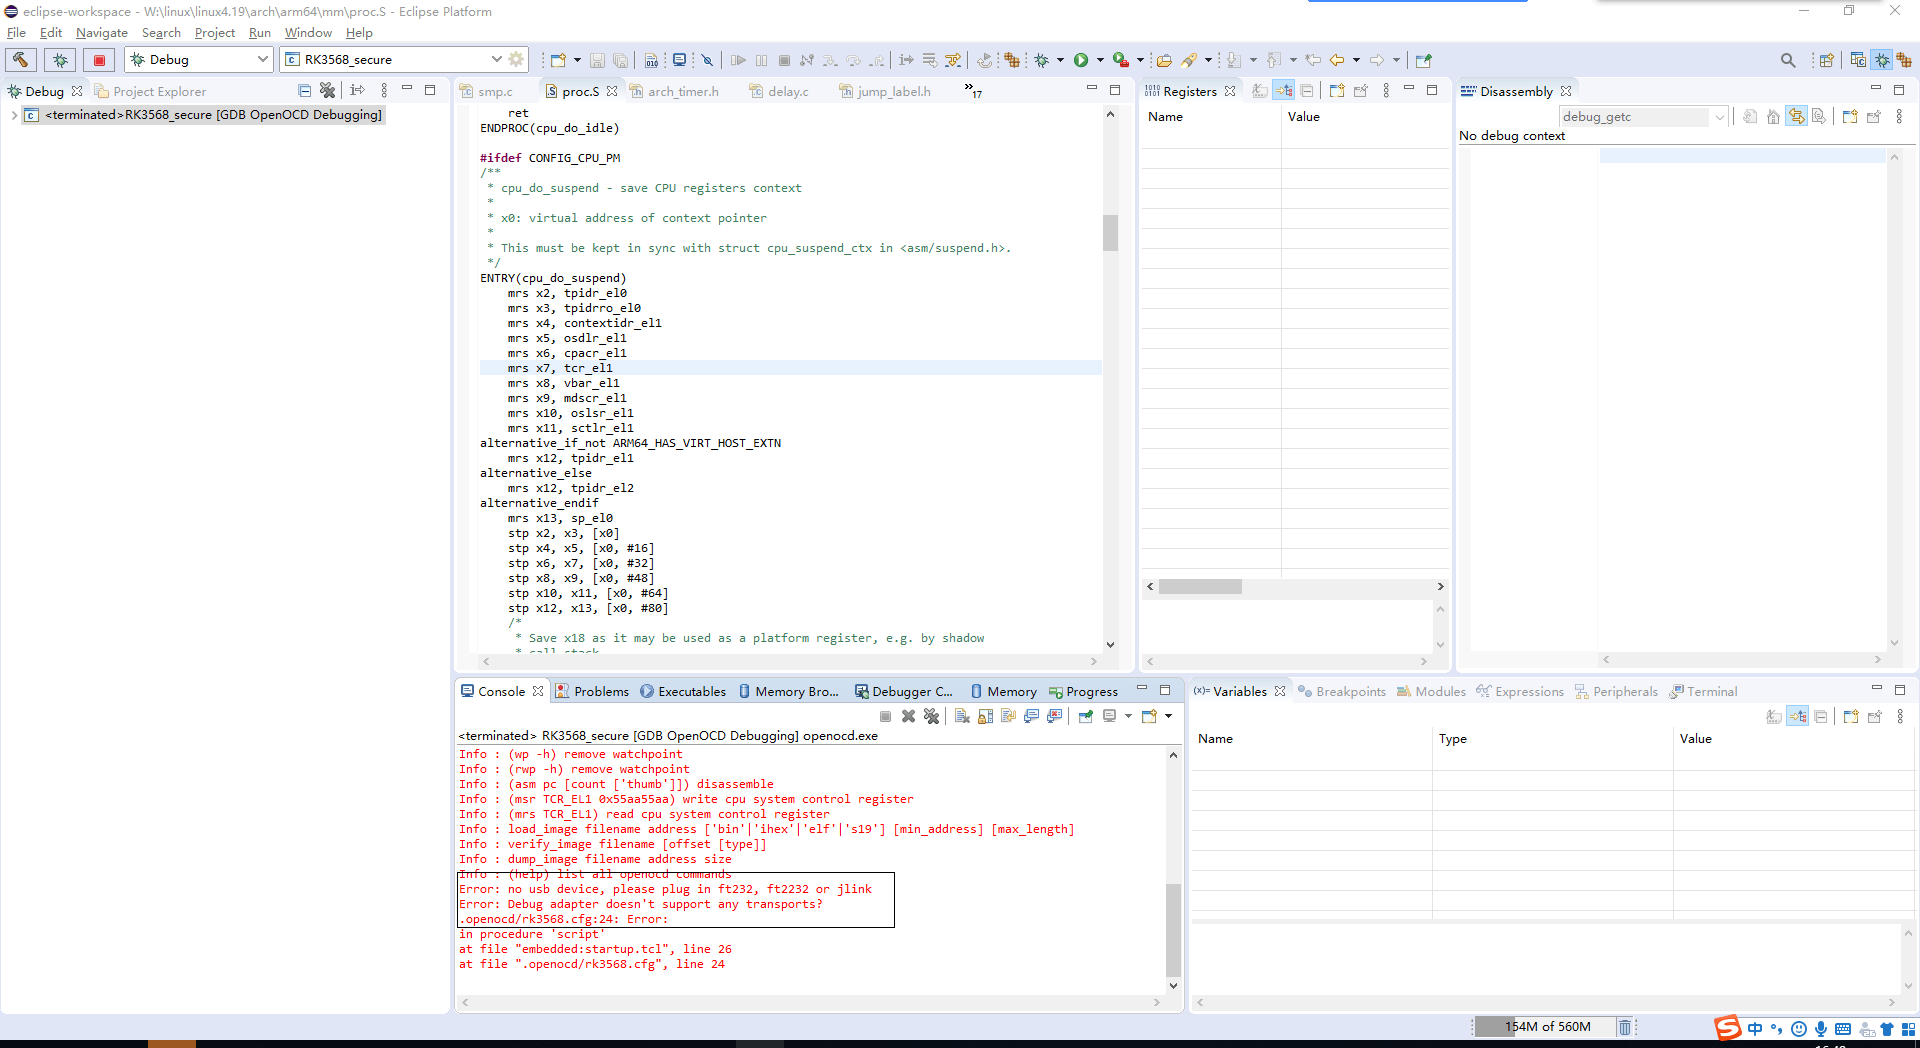
3.2.5.2 Chip not detected
Check pin contact and whether JTAG IOMUX is enabled; reduce TCK if necessary. The following message means hardware/JTAG detection works, but the chip state is incorrect and debugging cannot continue.
the connection is ok, but the cpu is in incorrect state
These two messages indicate a wiring, IOMUX or pin-contact problem:
please check hardware, make sure swd/jtag iomux is correct, and the pins connection is ok
please check hardware, the swdio(tms) pin is low level
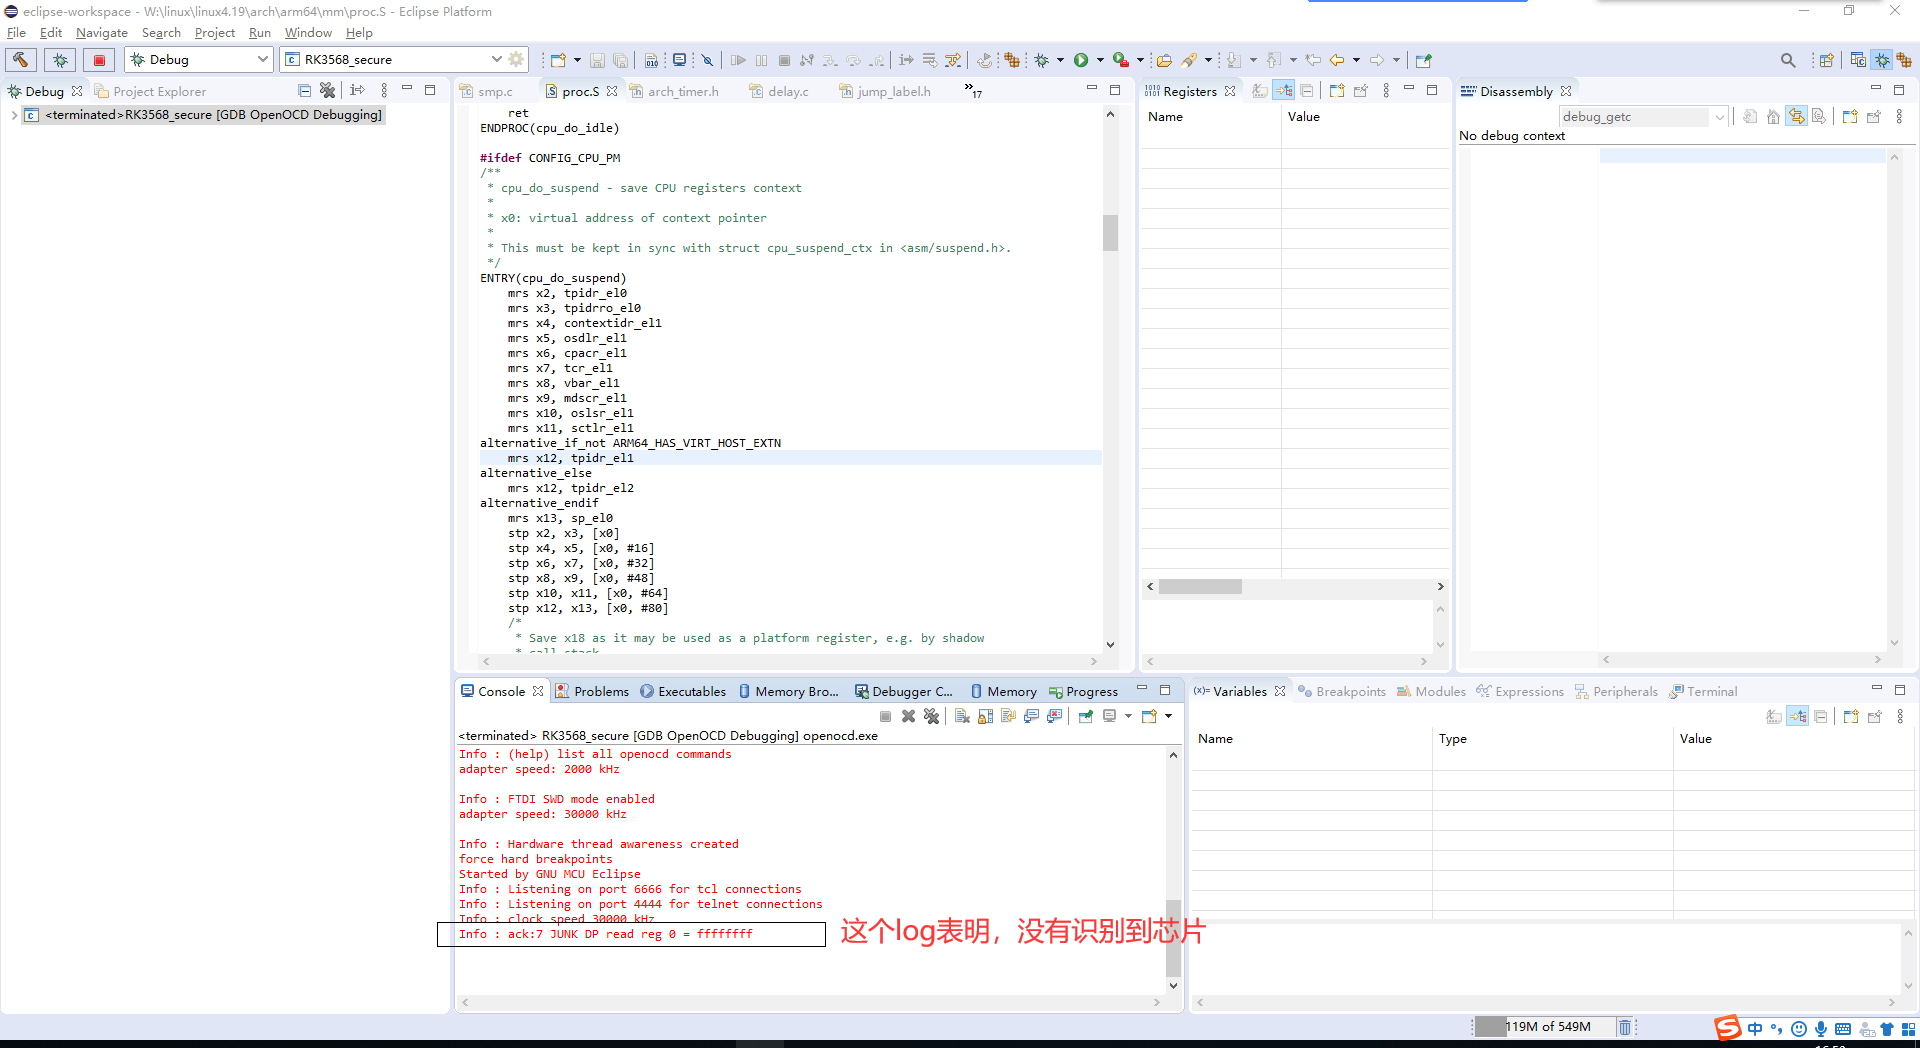
When the following log appears, reduce the JTAG rate and retry.
Please, adapter speed 1000 set clk 1MHz to try again
4. Basic debugging
4.1 Adjusting SWD/JTAG speed
If hardware limitations prevent communication, lower TCK, for example to 1000 KHz. The source maximum is 30000 KHz and its recommended values are 15000 KHz or 7500 KHz; actual suitability depends on the board connection and adapter.
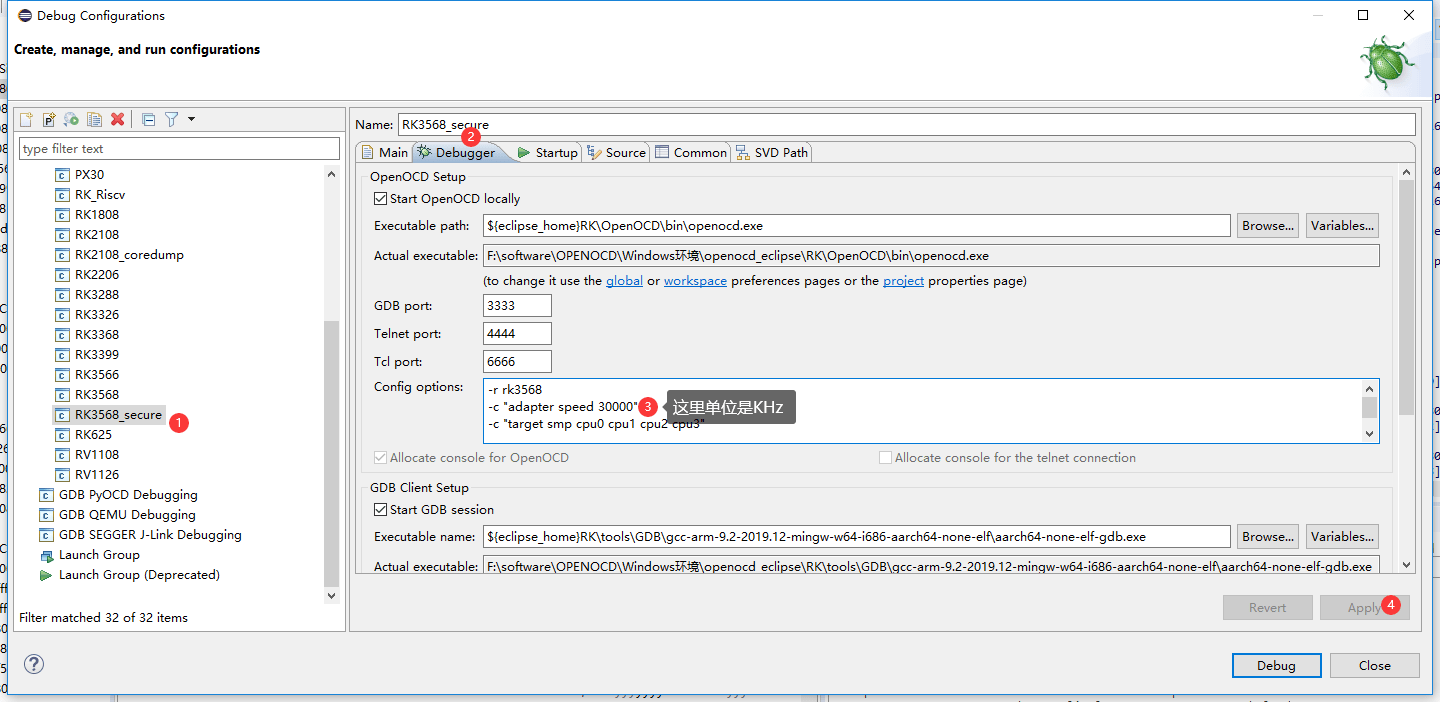
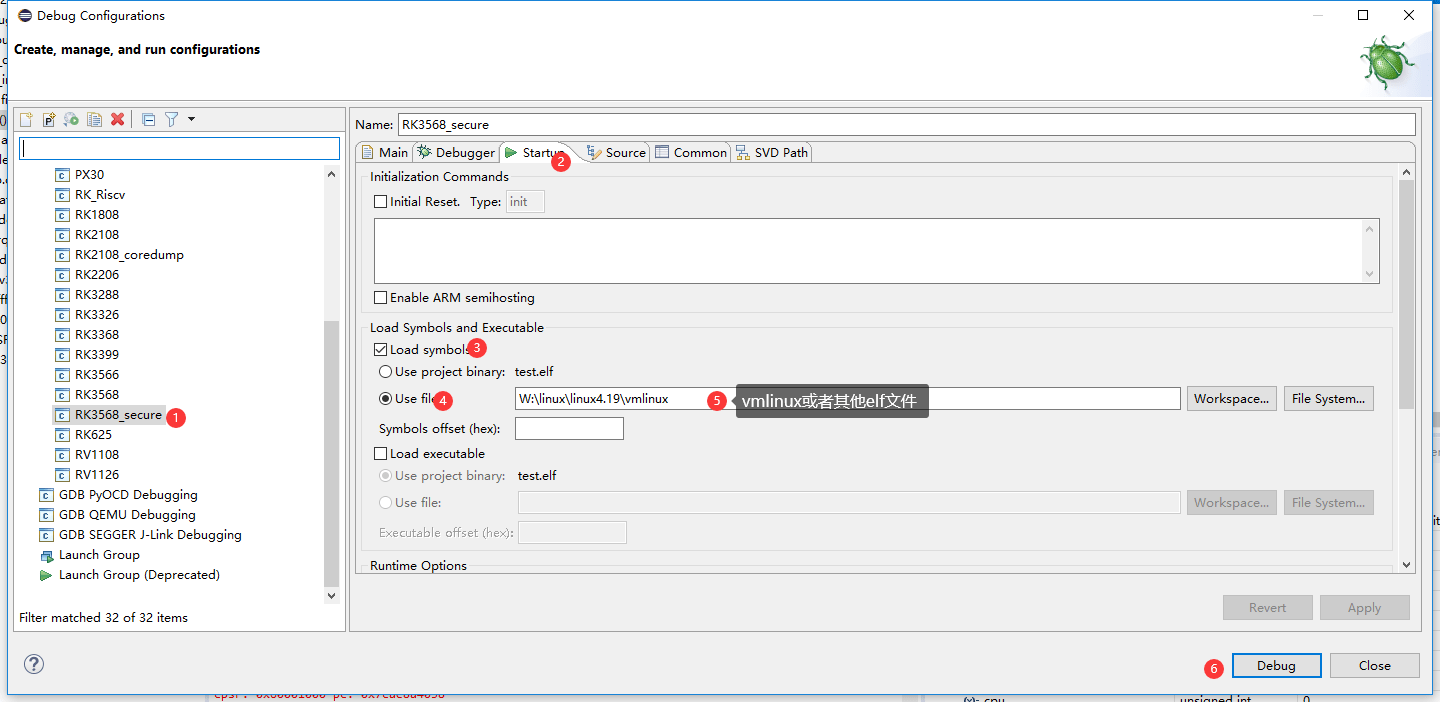
4.2 Static symbol loading
Configure this before connecting; only one symbol table can be loaded statically.
4.3 Dynamic symbol loading
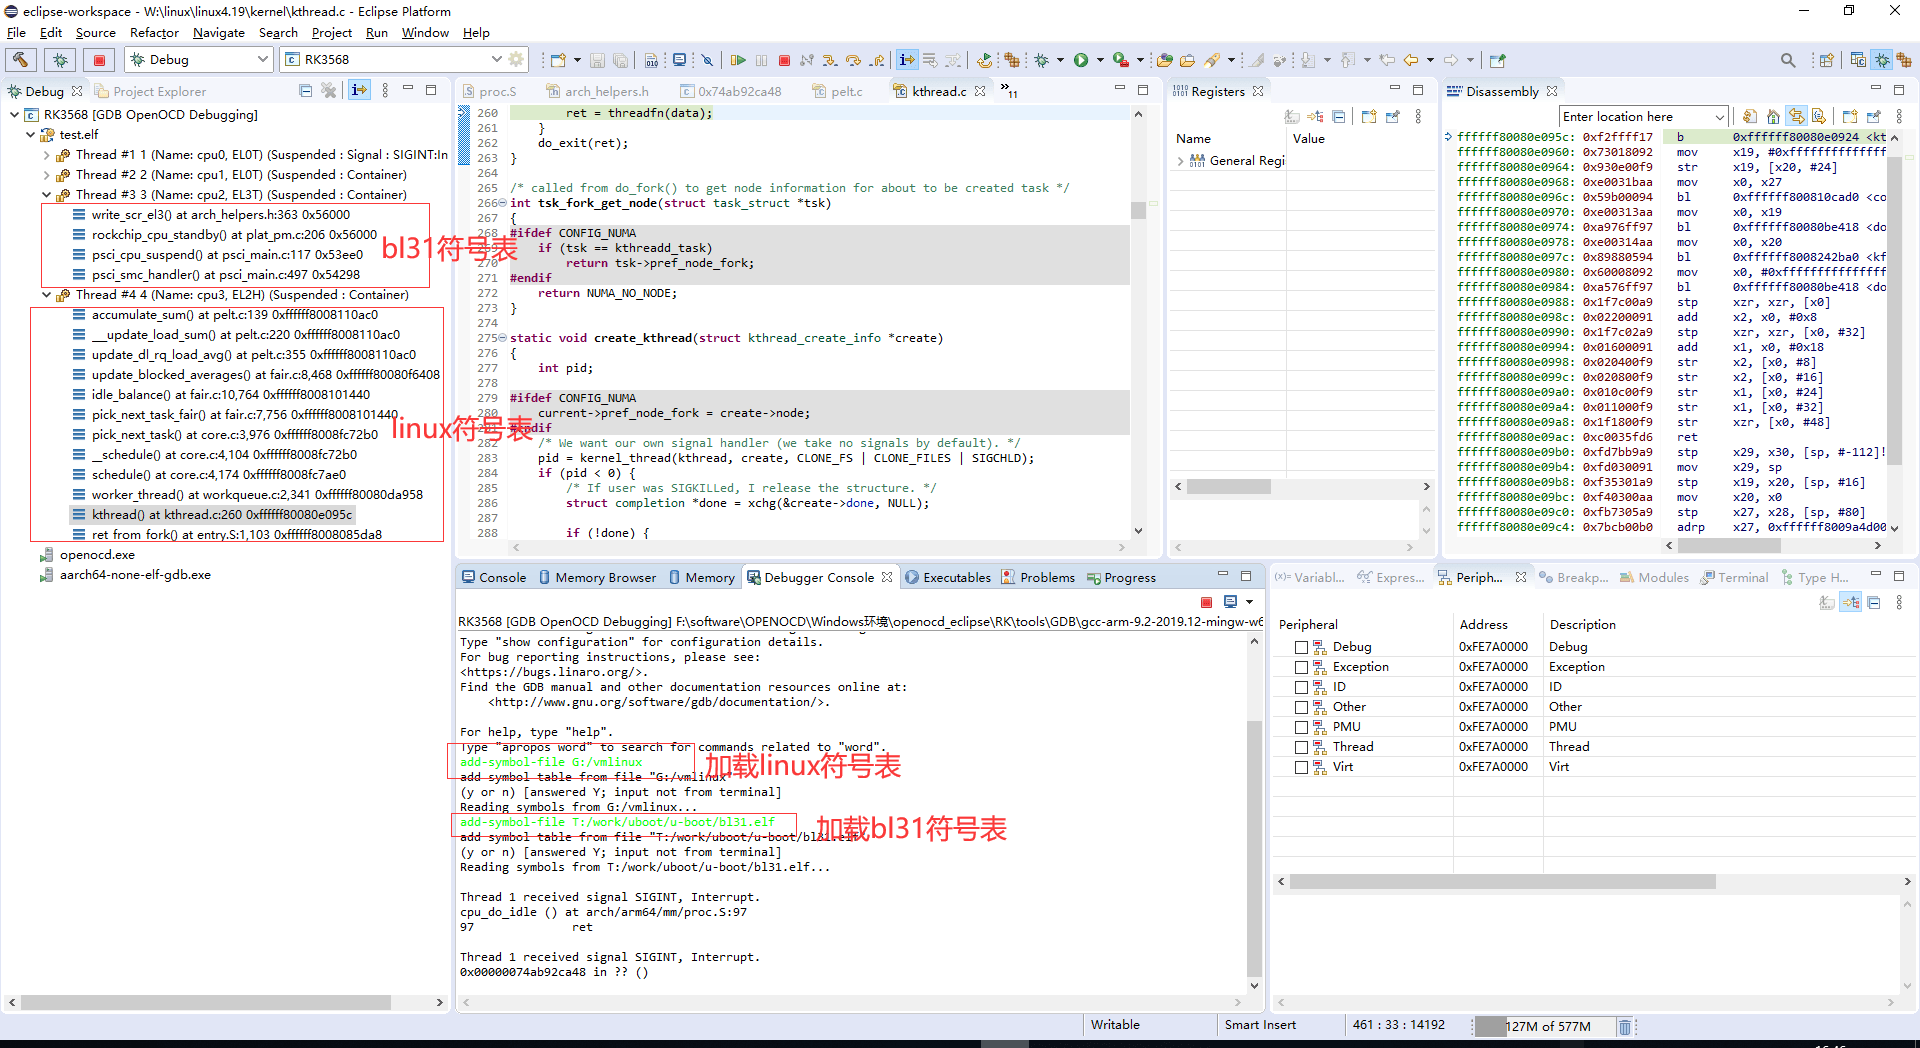
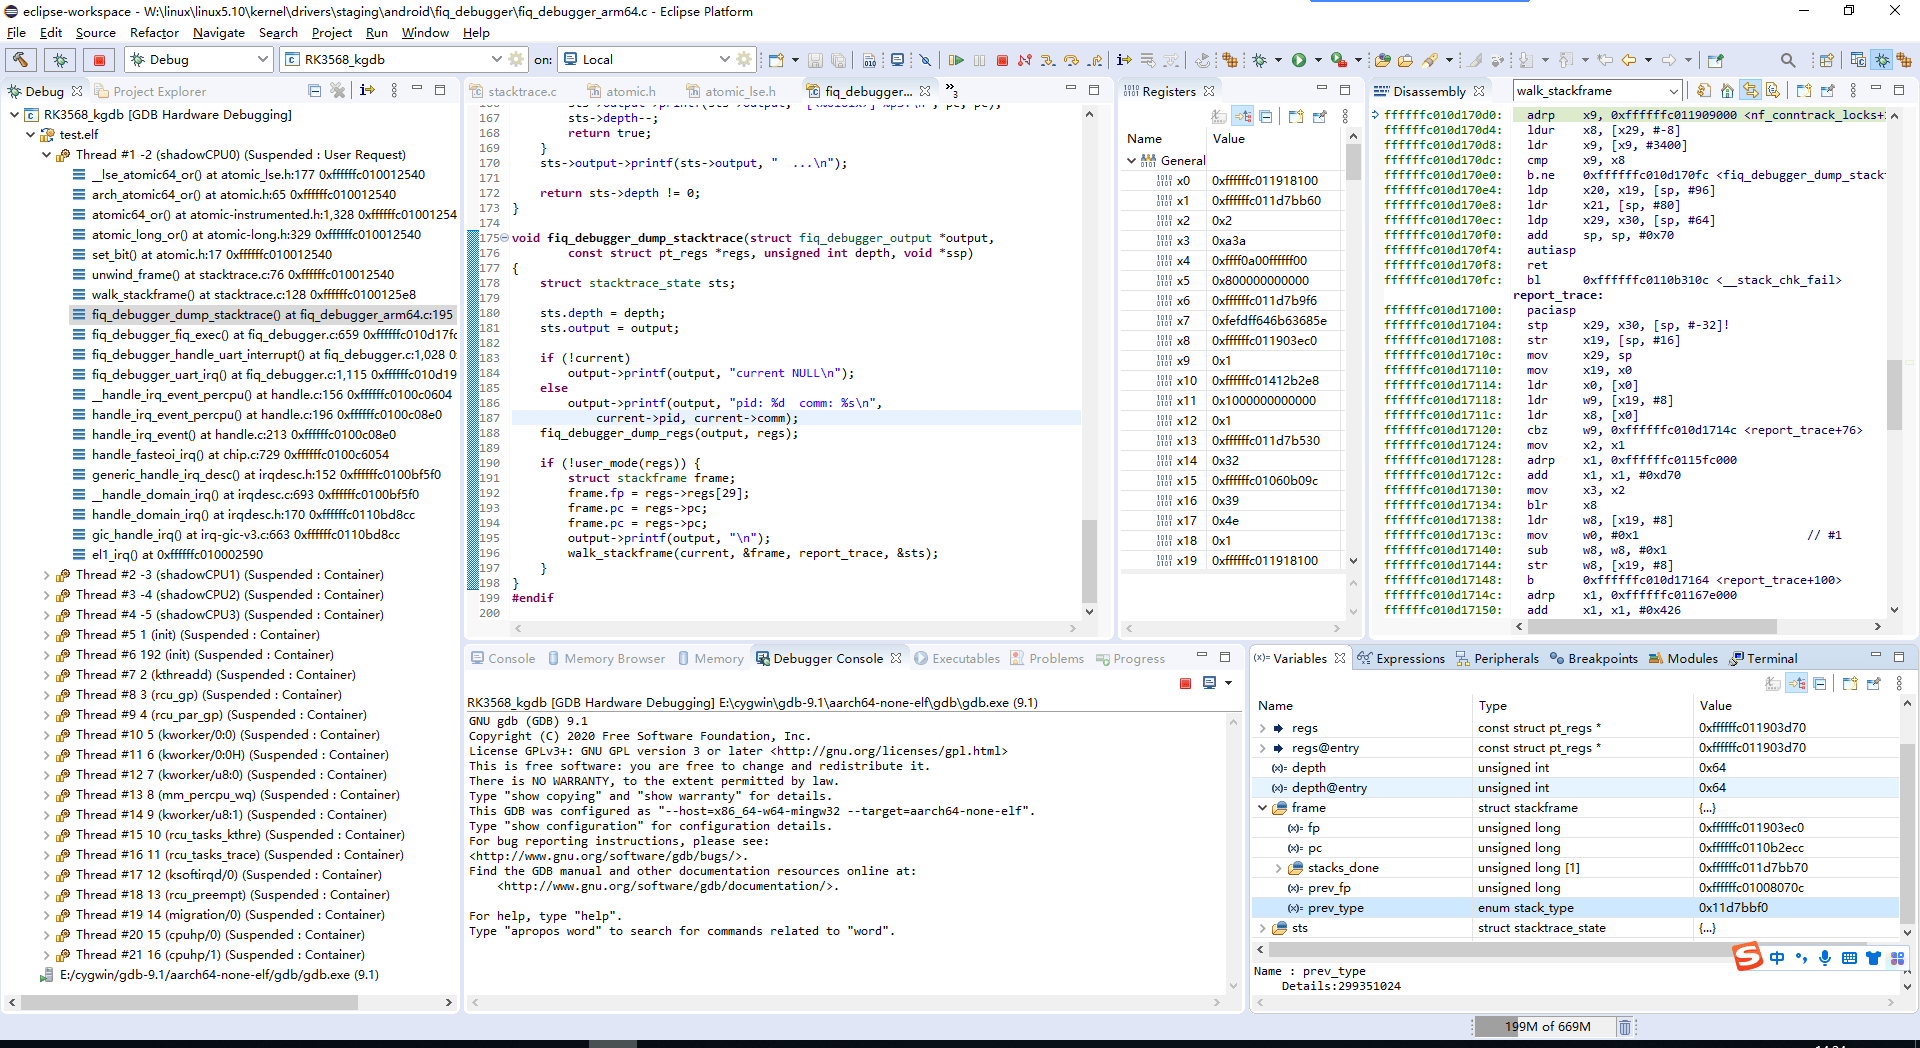
Debugger Console accepts GDB commands. Use add-symbol-file to load multiple symbol tables. The following load Linux, BL31, TPL, SPL and U-Boot respectively. Replace Windows backslashes with forward slashes. After loading, execute one step before the call stack is displayed.
 加载linux符号表:add-symbol-file G:/vmlinux
 加载bl31符号表:add-symbol-file T:/work/uboot/u-boot/bl31.elf

 加载tpl符号表:add-symbol-file T:/work/uboot/u-boot/tpl/u-boot-tpl
 加载spl符号表:add-symbol-file T:/work/uboot/u-boot/spl/u-boot-spl
 加载uboot符号表:add-symbol-file T:/work/uboot/u-boot/u-boot
4.4 Setting source paths
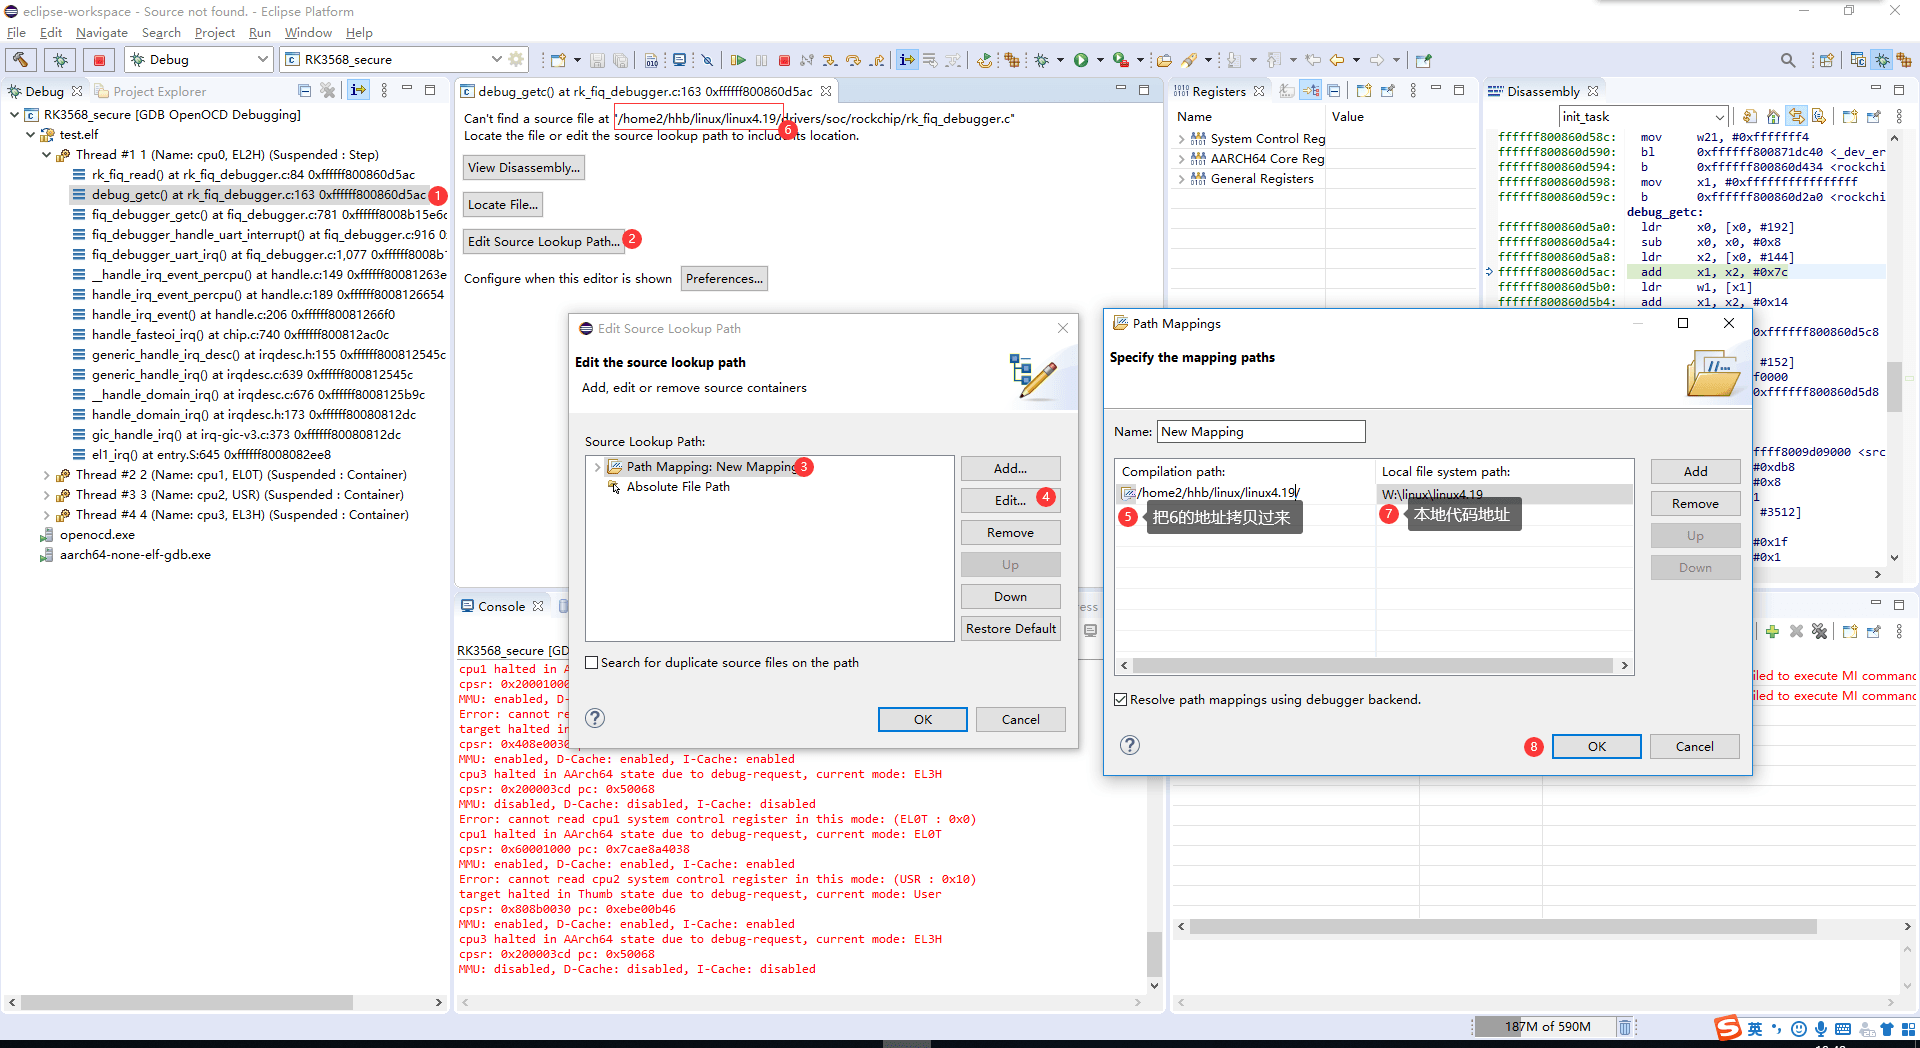
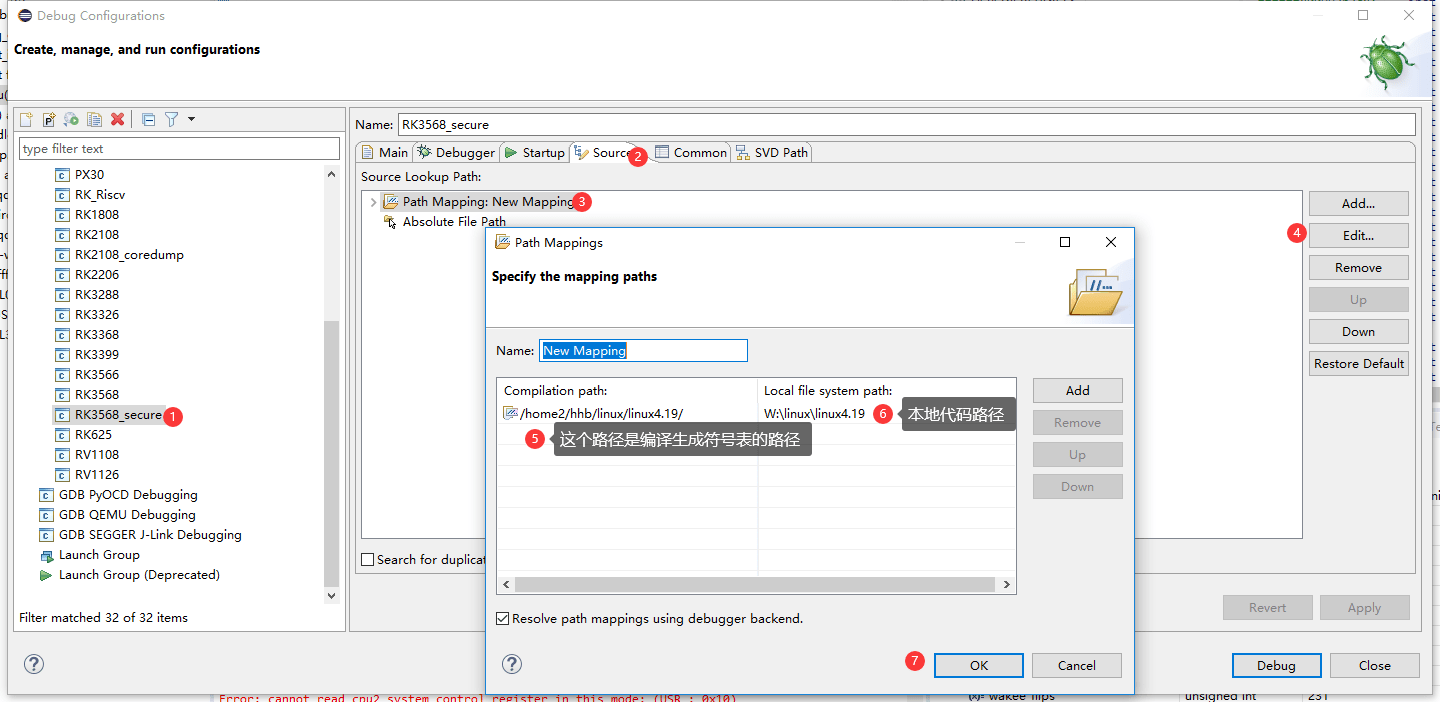
Method 1 uses the source lookup interface; method 2 uses Debug Configurations, as shown in the two source screenshots.
4.5 Viewing disassembly
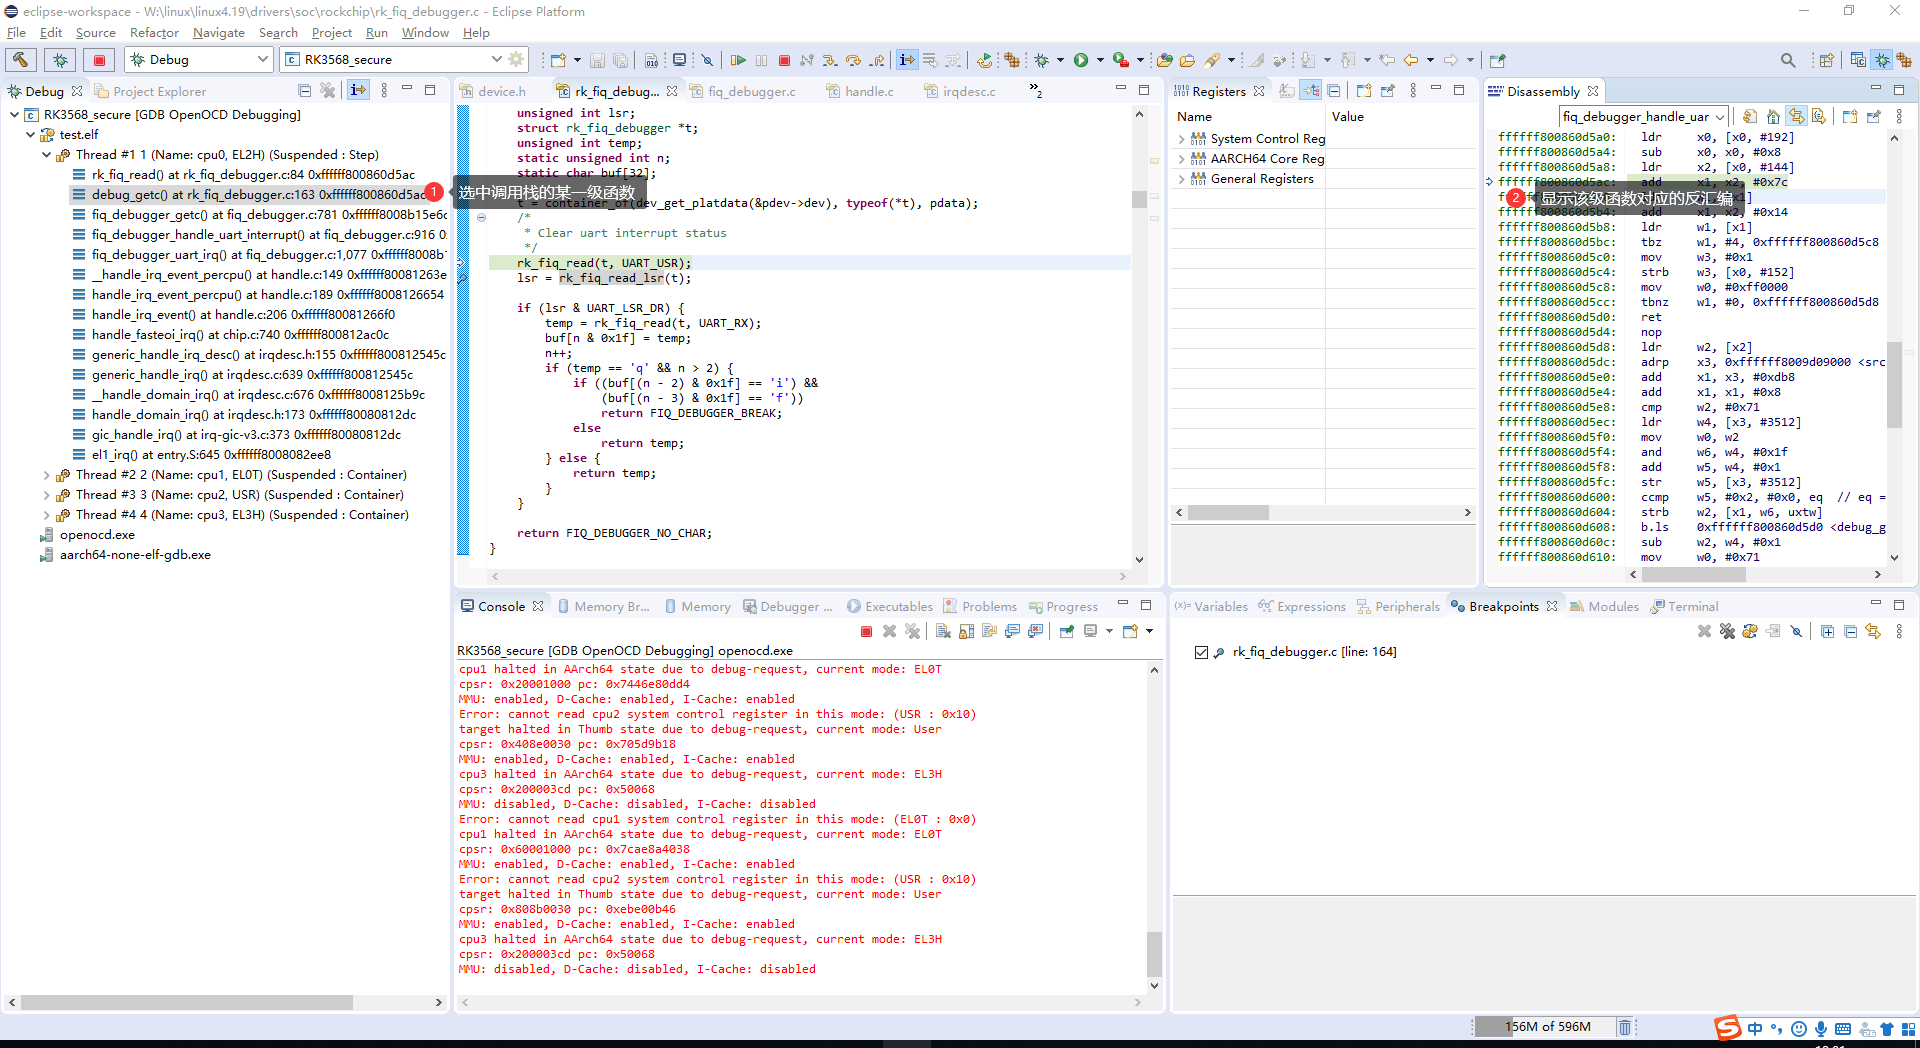
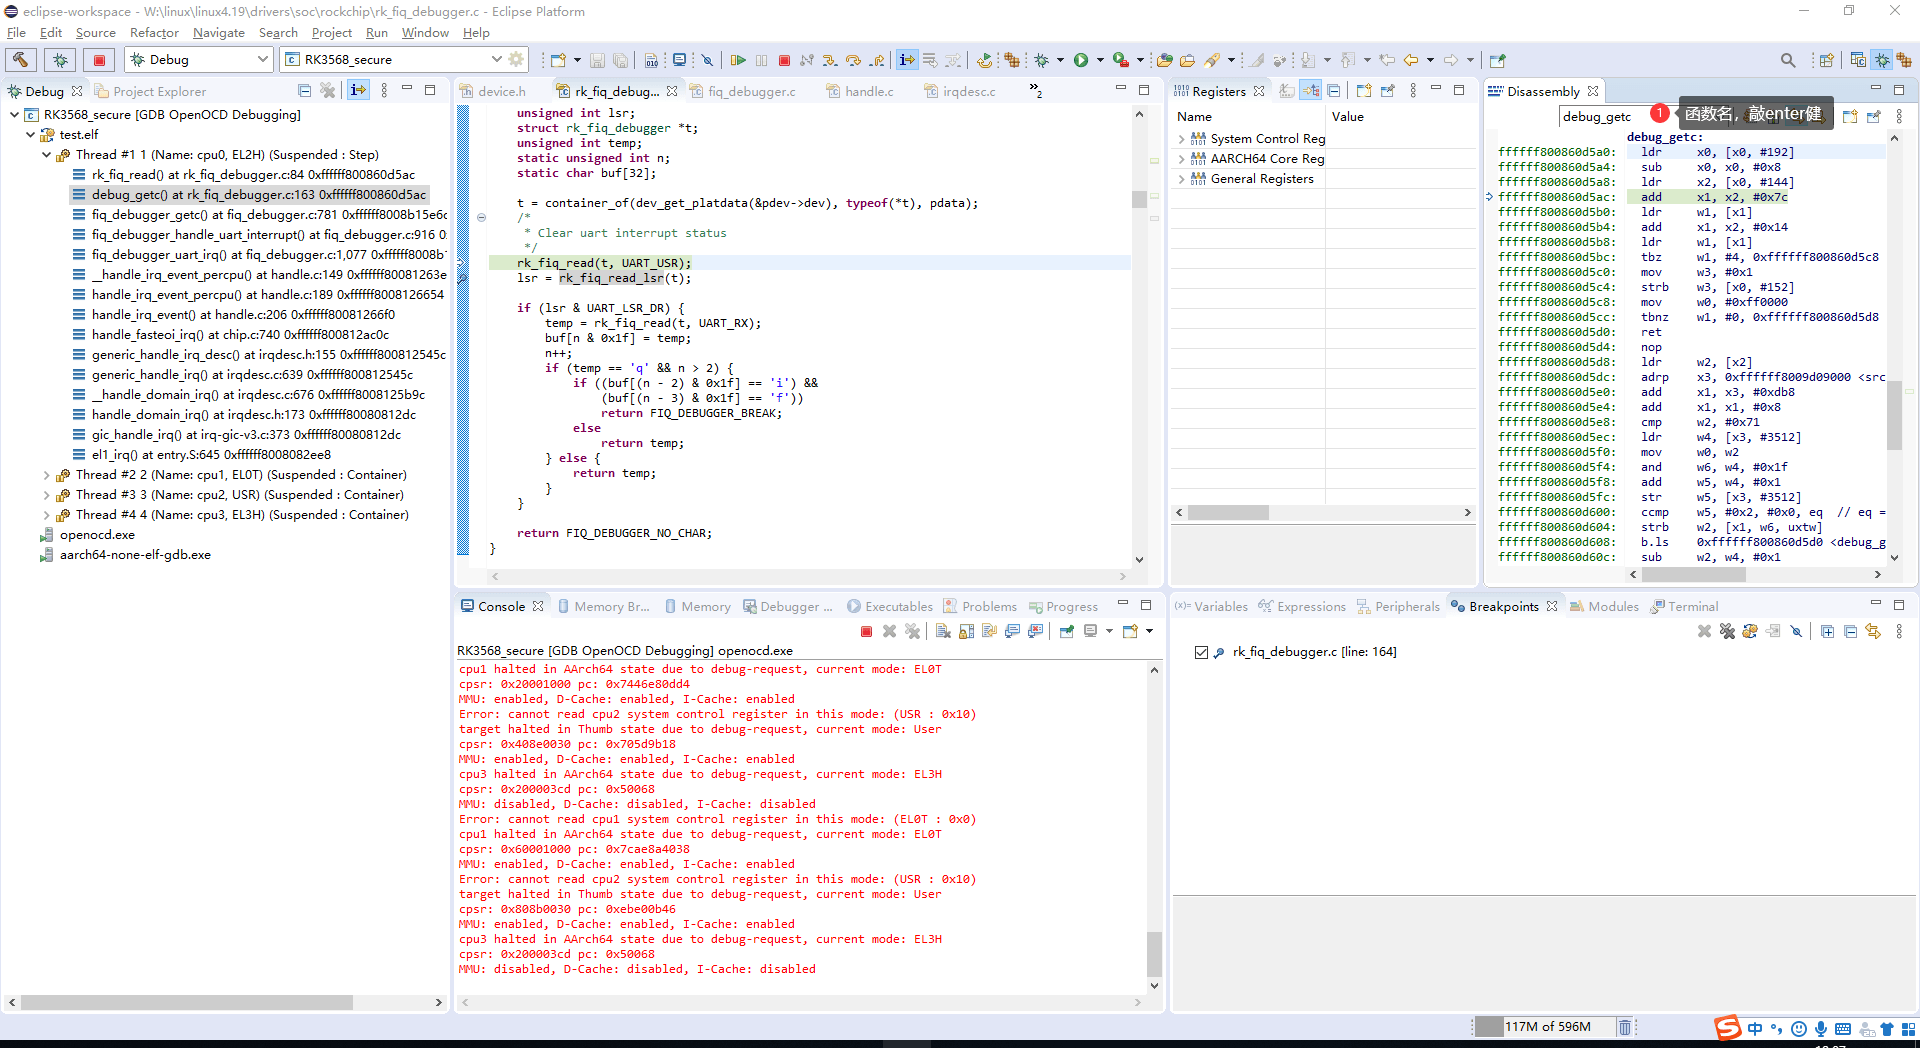
Disassemble a call-stack function, a selected address or a named function. Looking up a function requires imported symbols.
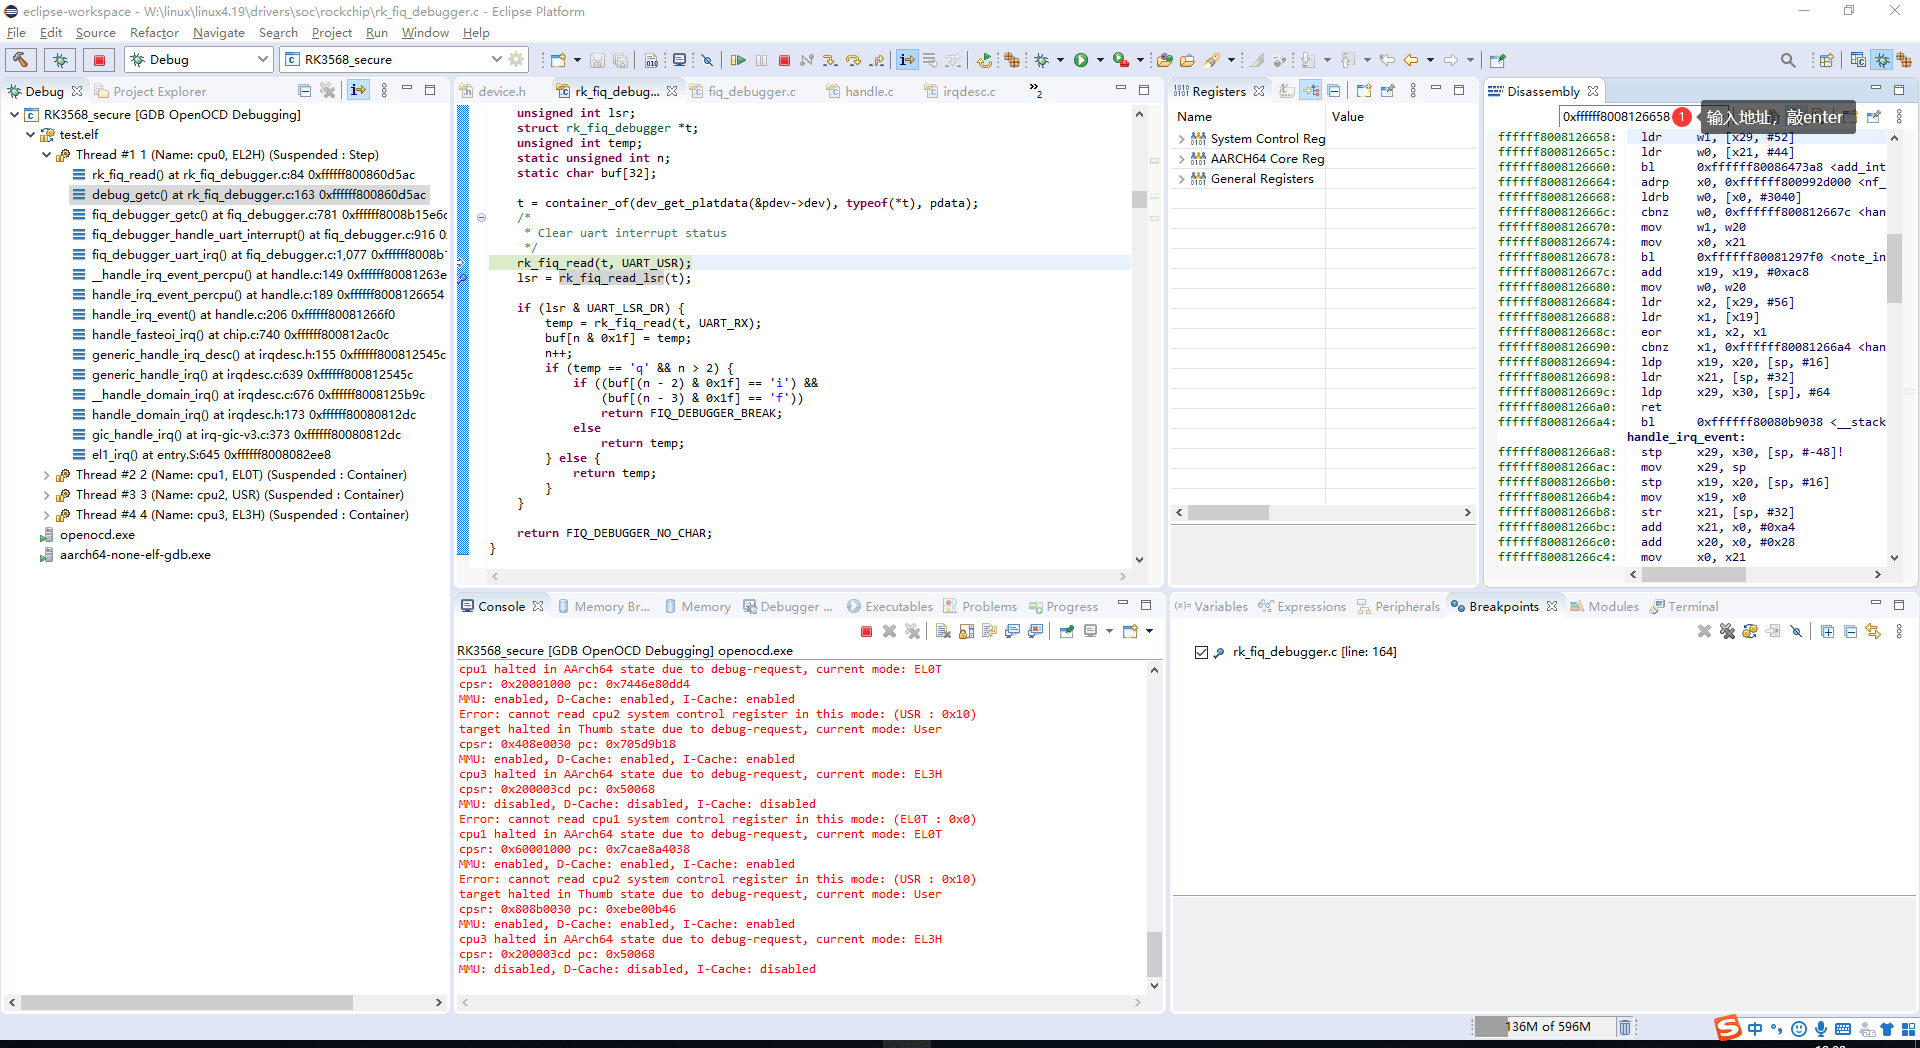
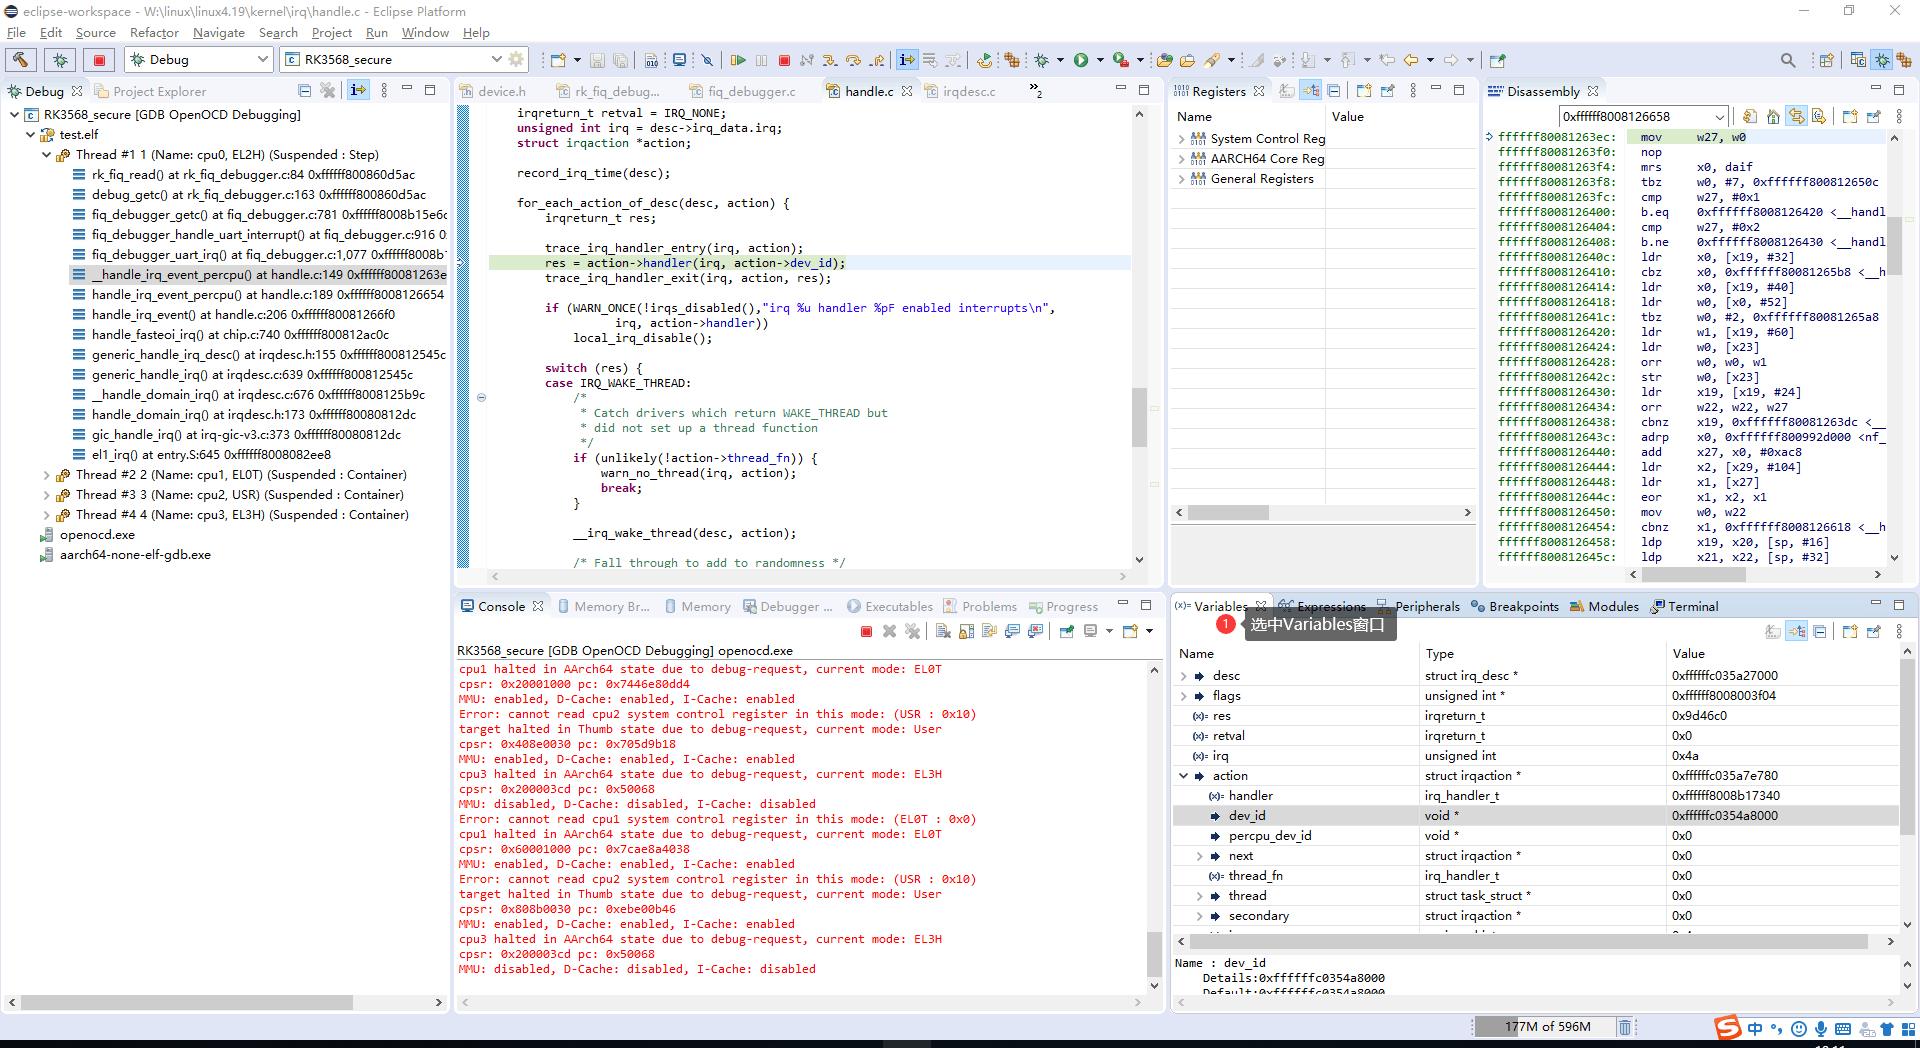
4.6 Viewing local variables
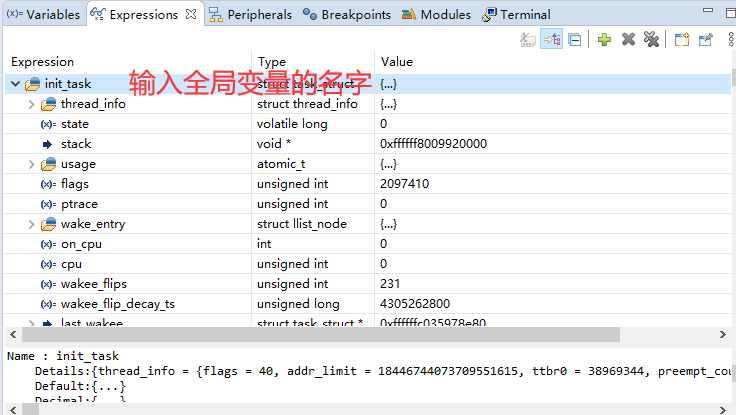
4.7 Viewing global variables
In Expressions, select Add new expression and enter a global variable name. Pointer expressions can also be entered.
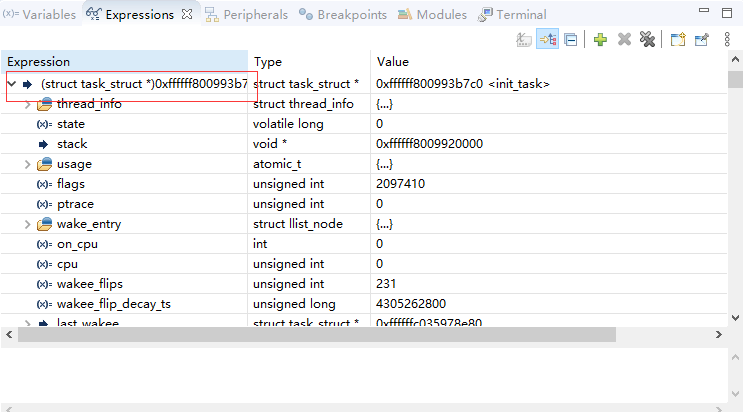
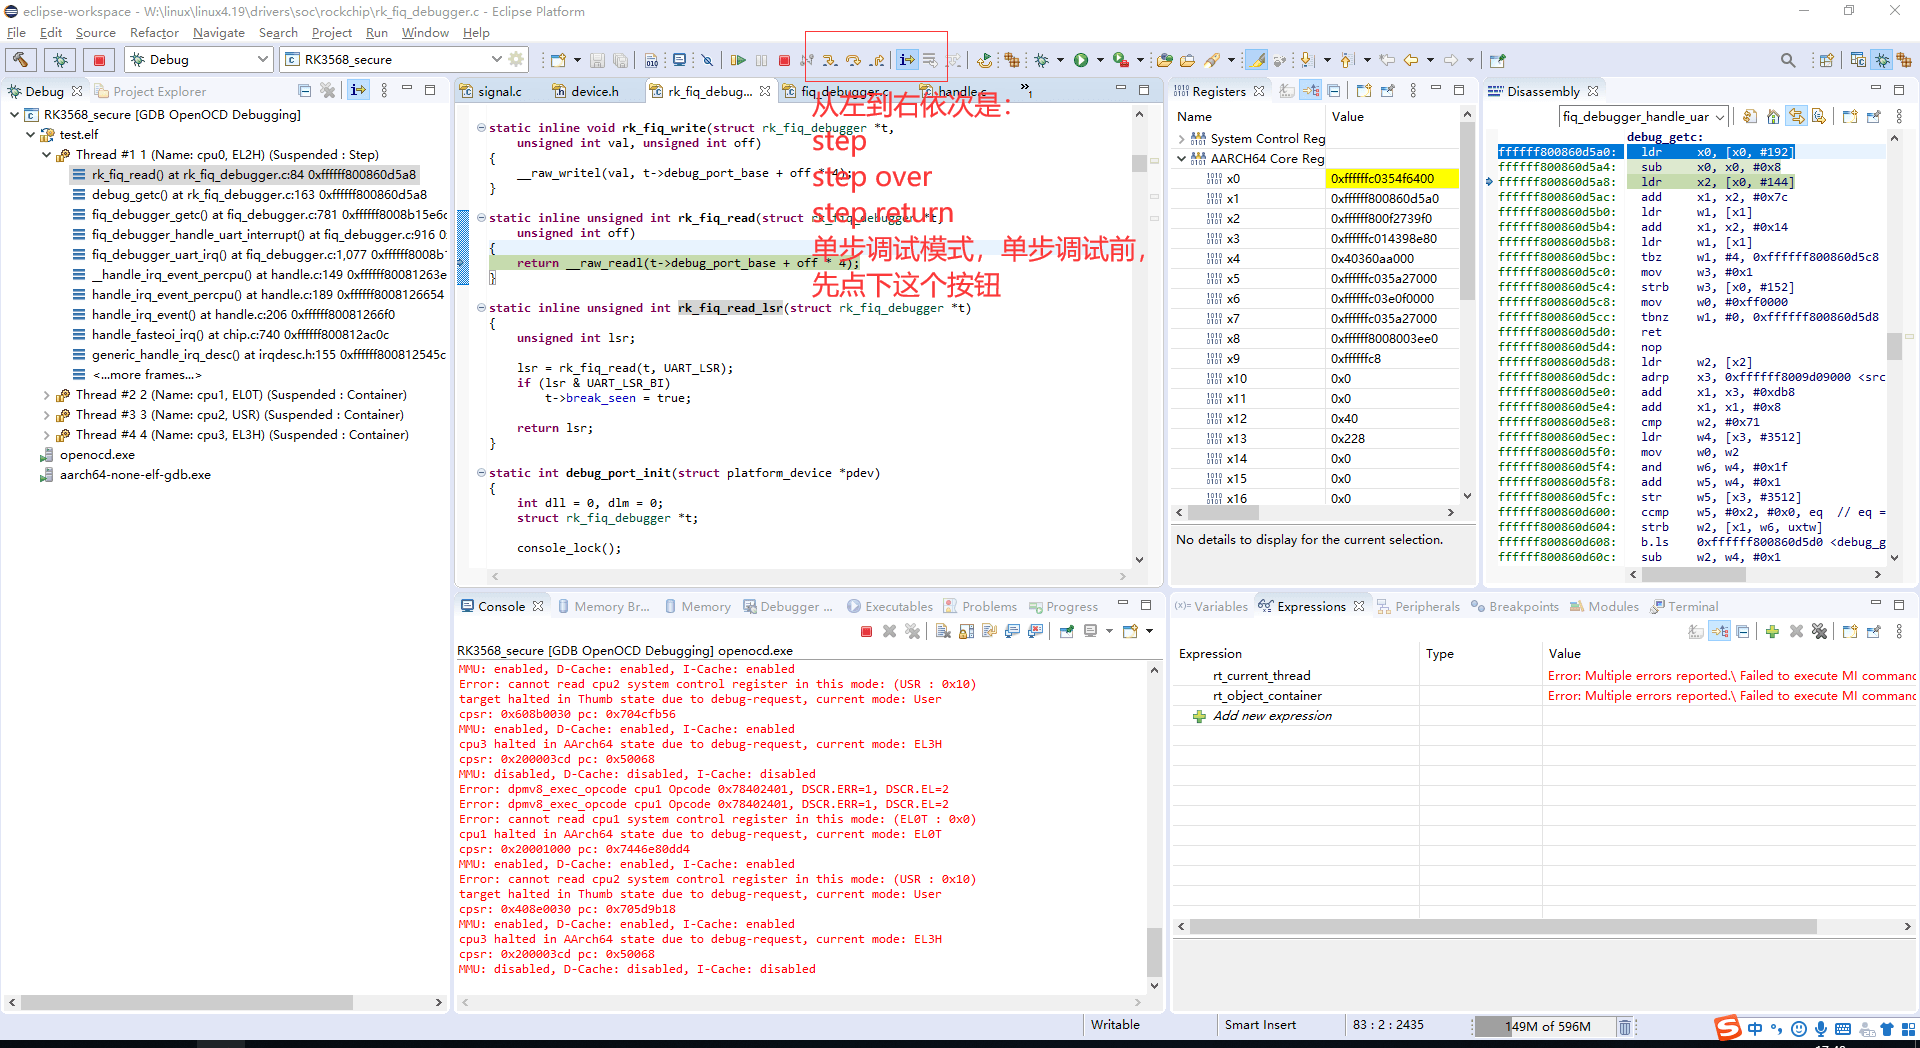
4.8 Single stepping
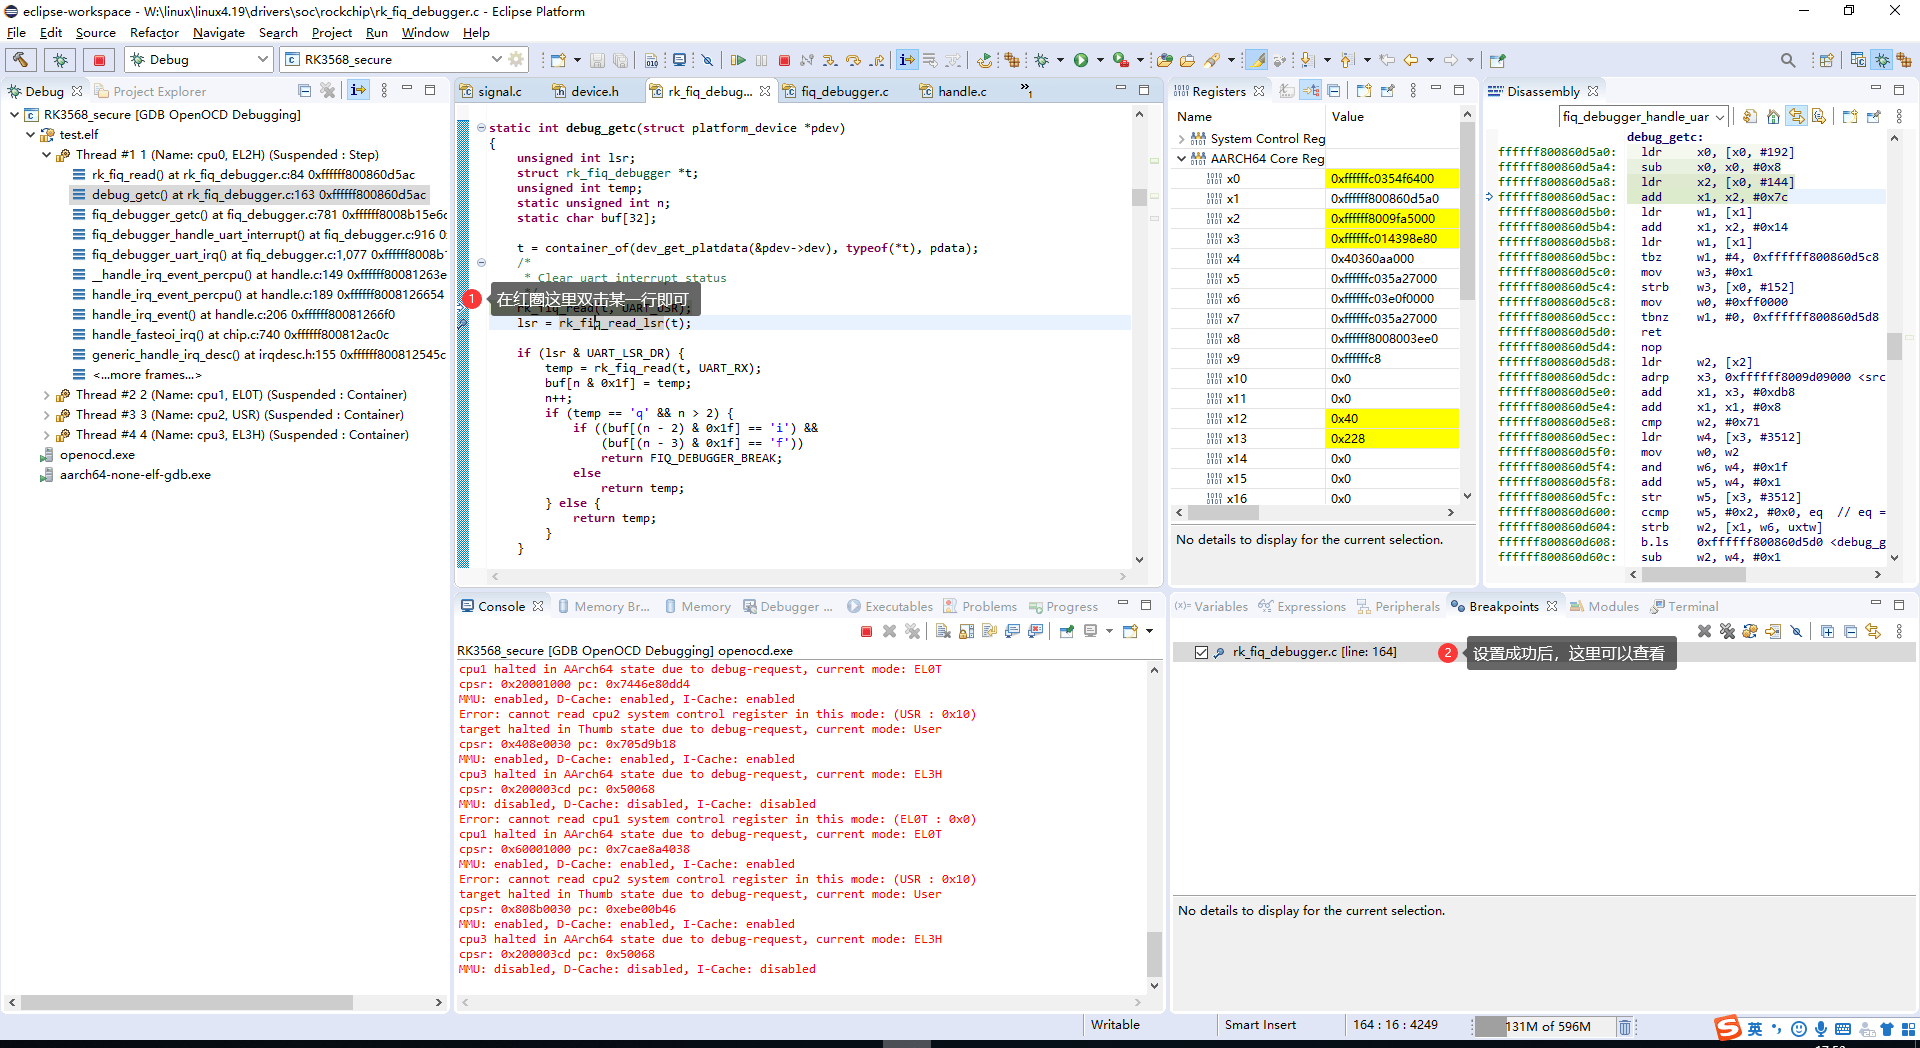
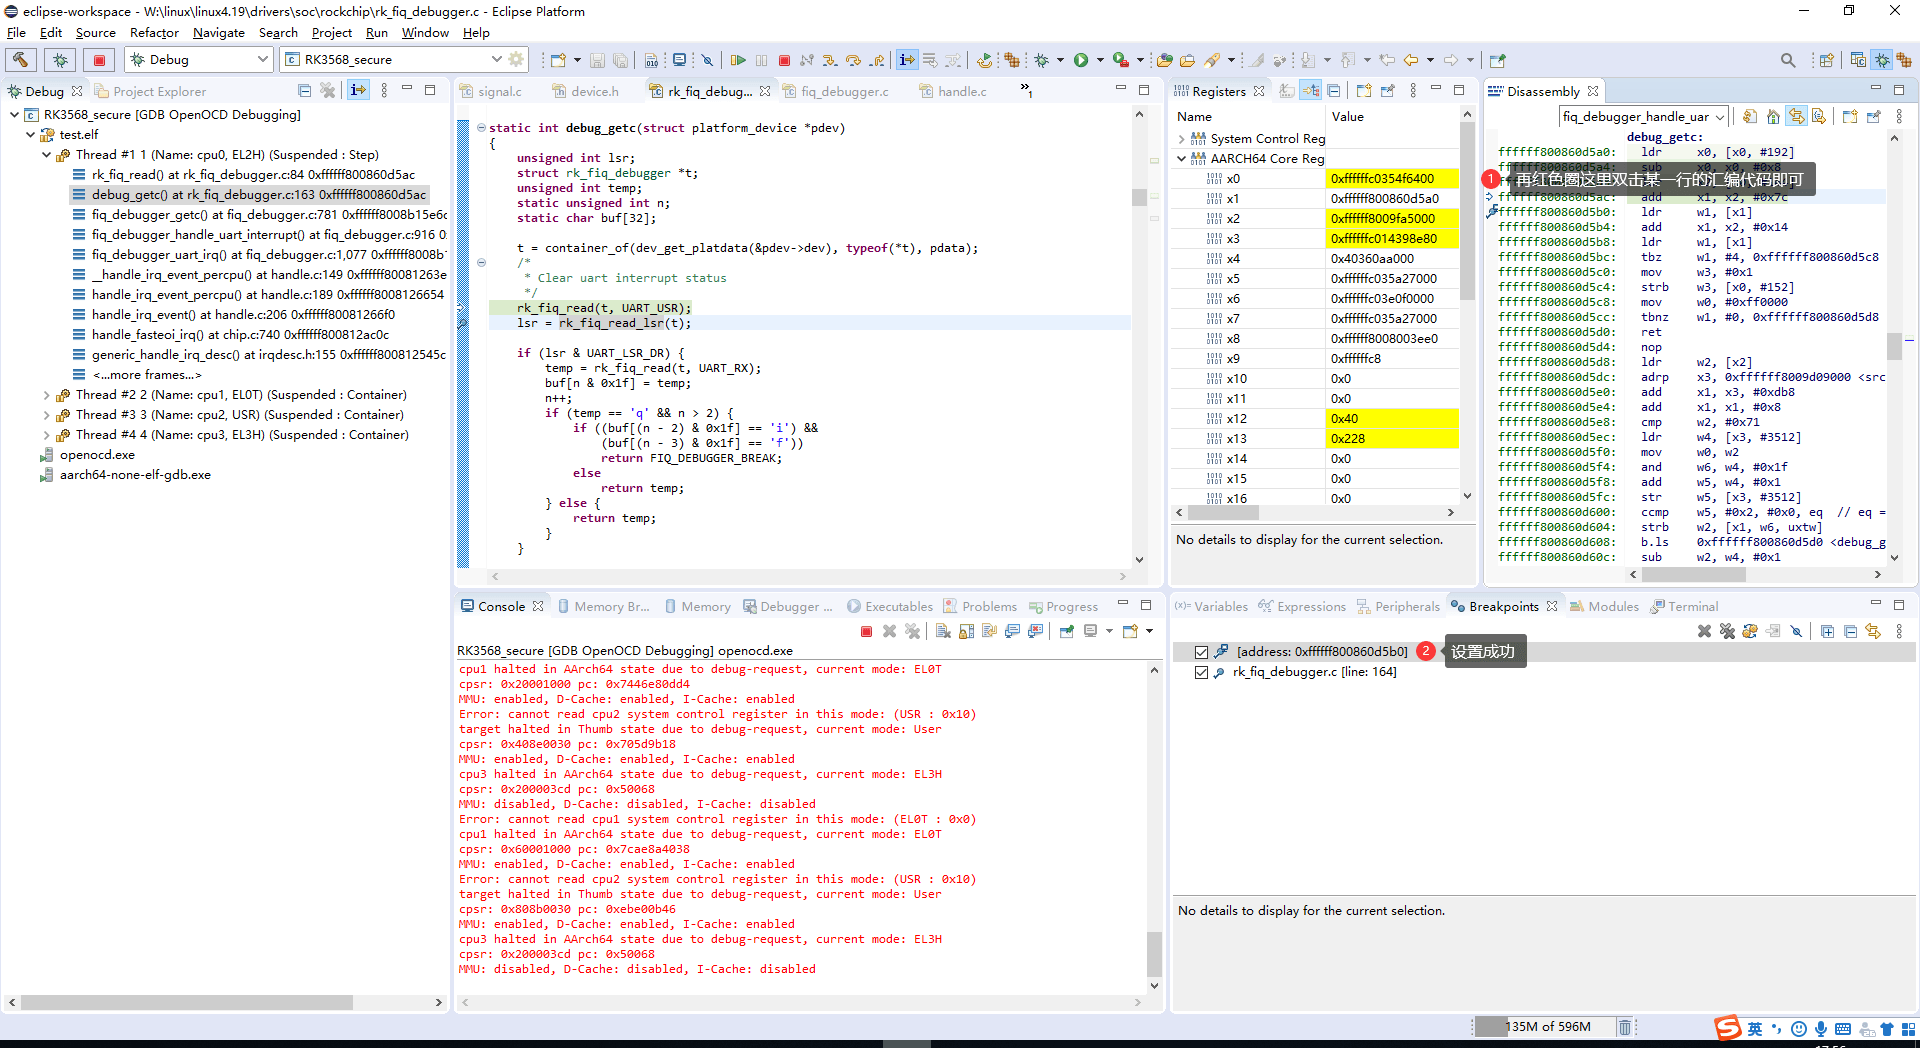
4.9 Setting breakpoints
Set breakpoints in the source-code or Disassembly window.
4.10 Viewing memory
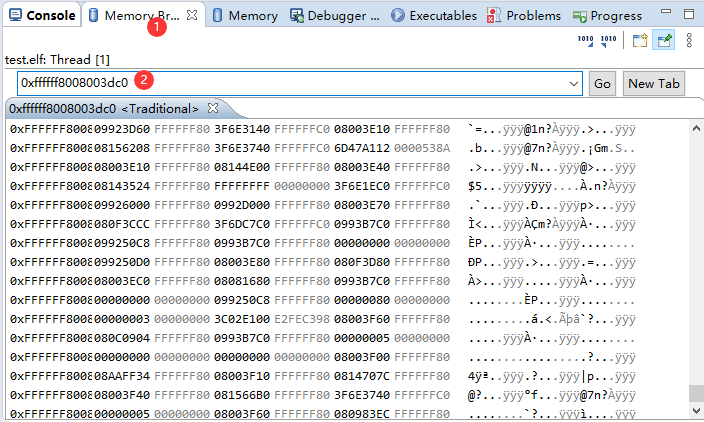
The source Memory Browser works correctly only with 32-bit addresses and has problems with 64-bit addresses. For 64-bit addresses, use OpenOCD command mode with mdw, mww, smdw, smww, io and related commands.
5. Advanced debugging
5.1 Register groups
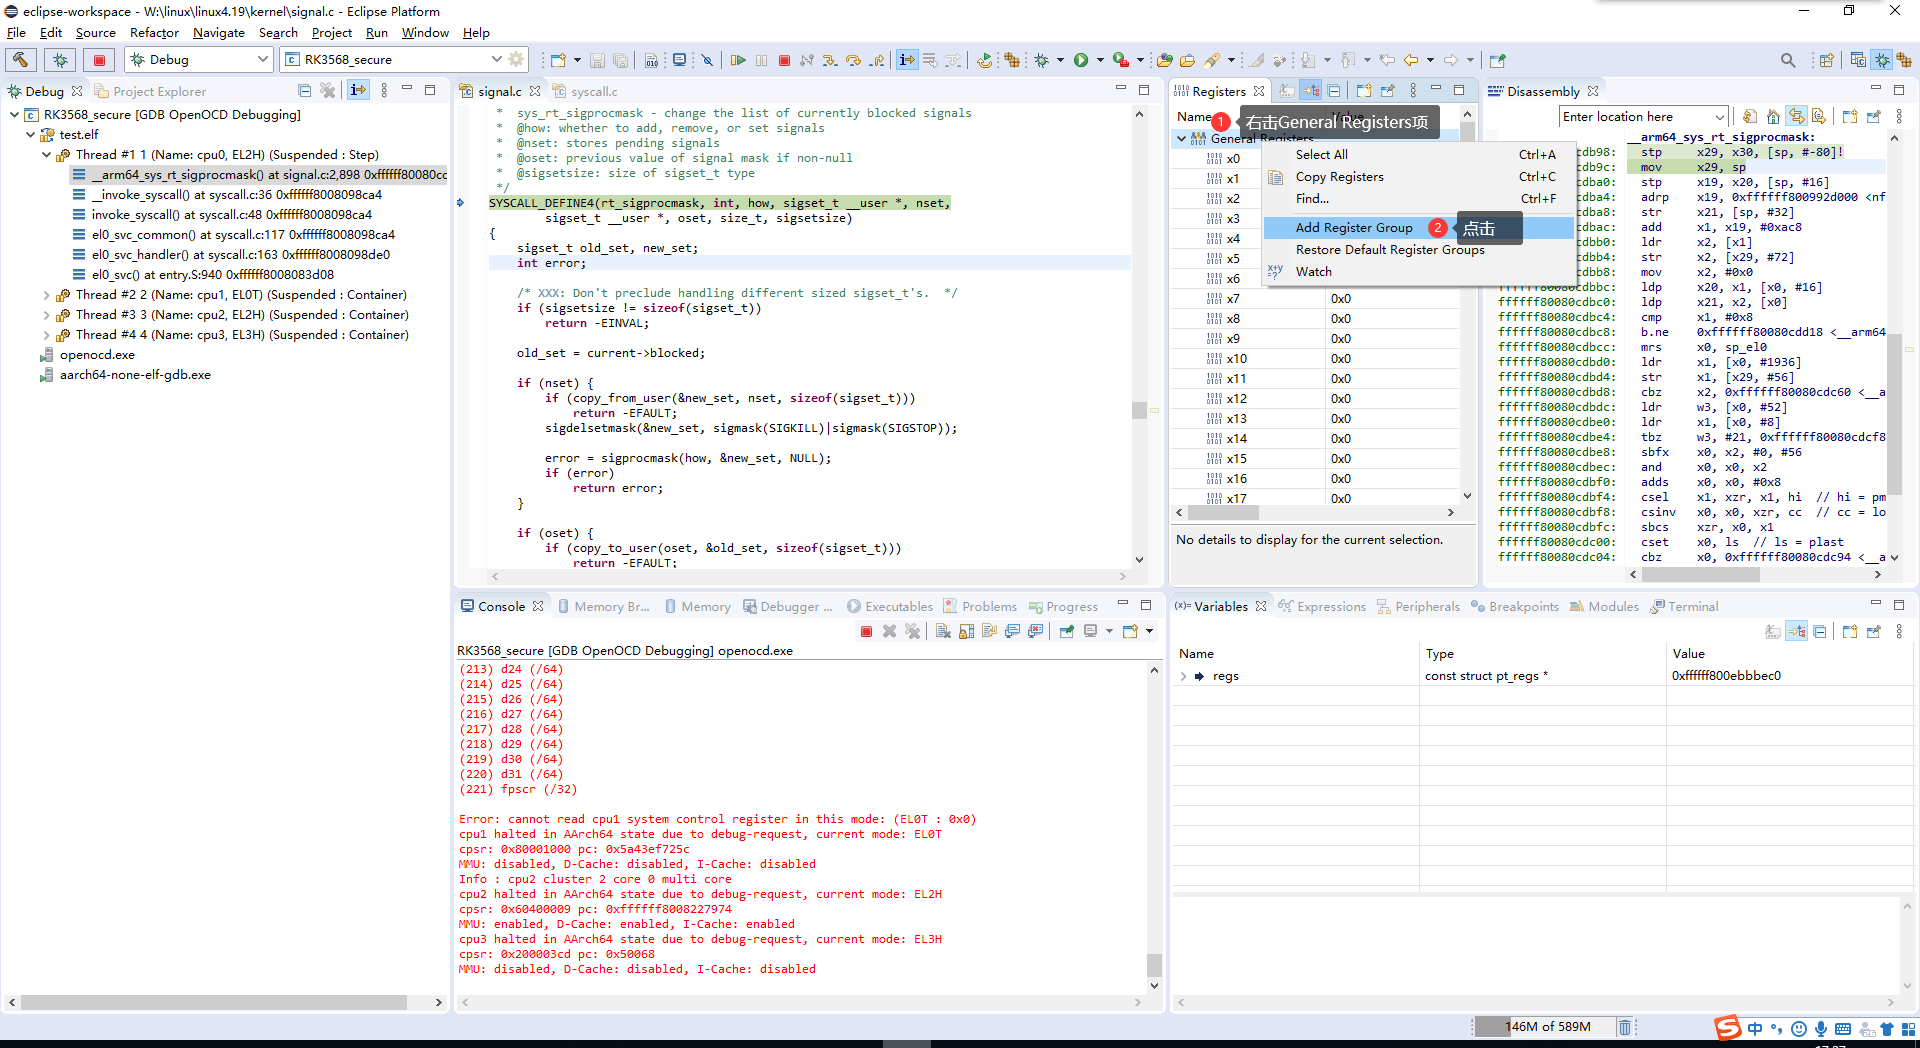
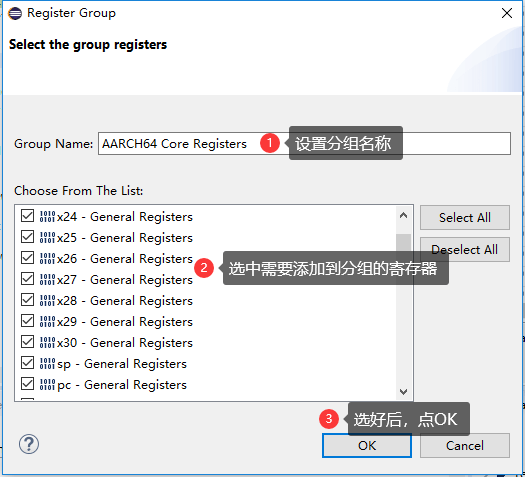
Grouping makes large register sets easier to inspect.
5.2 Selecting a CPU
5.3 Secure debugging
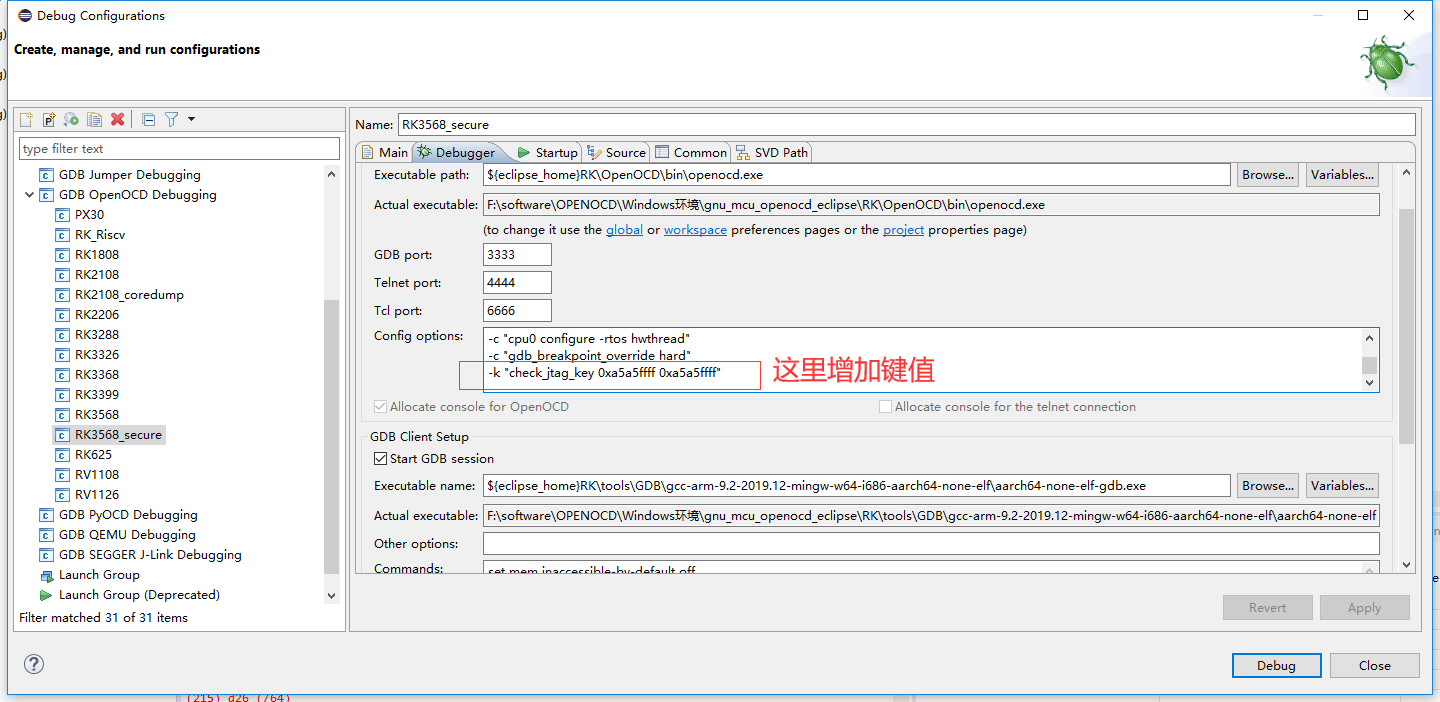
When a product enables a security policy, JTAG debugging requires an authorized key. This describes the authentication entry point, not a security-policy bypass.
5.4 OpenOCD in a command terminal
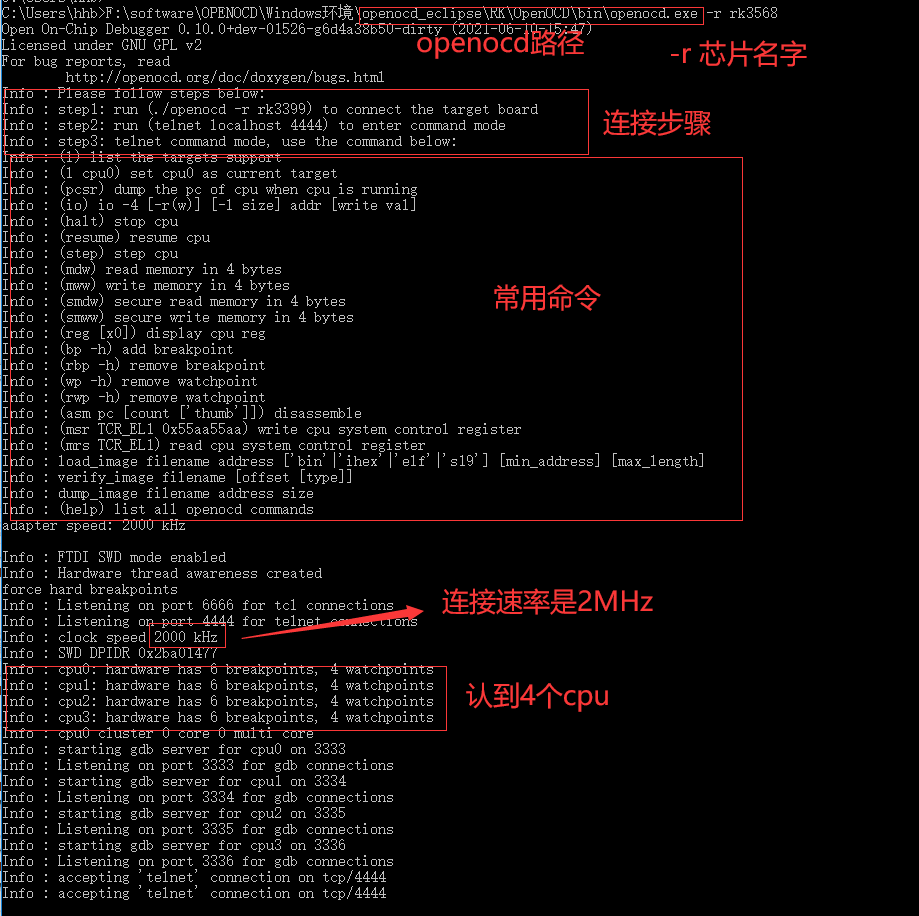
Open OpenOCD in cmd to view help. See the OpenOCD User’s Guide for more commands. In the source build, openocd.exe -r connects to the chip.
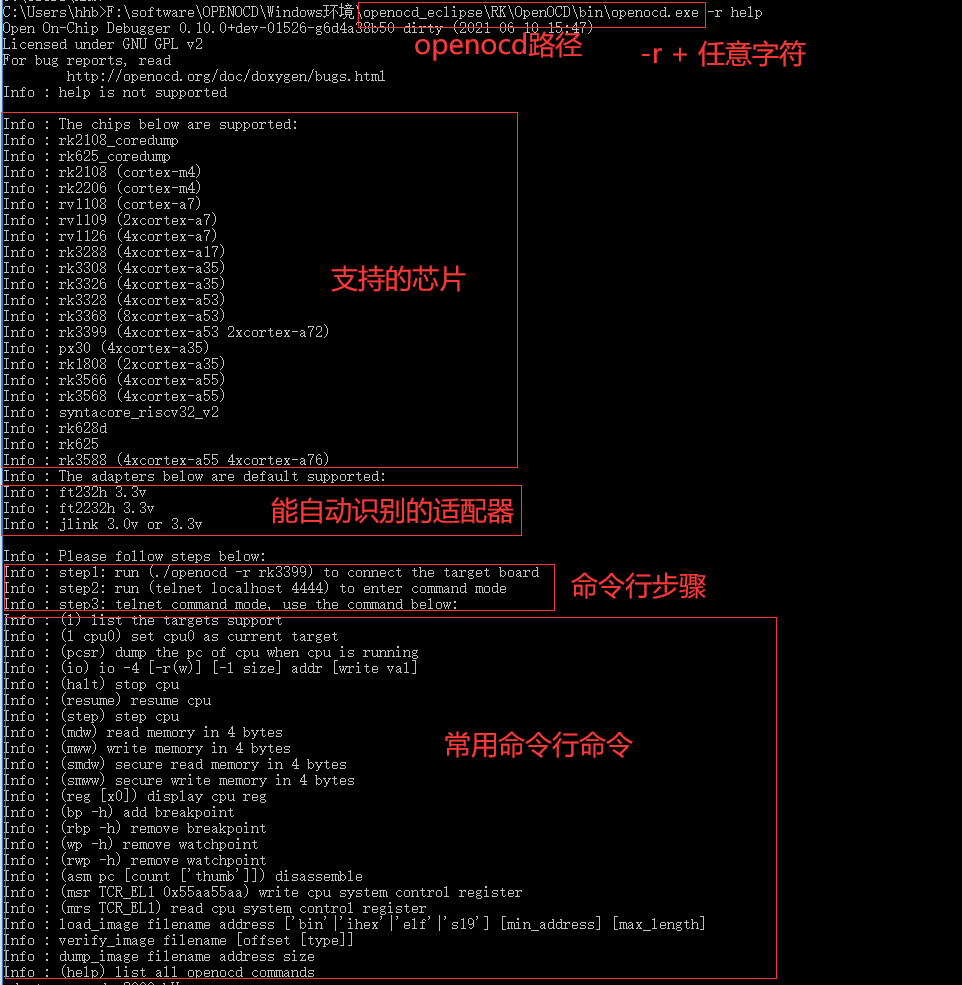
http://openocd.org/doc/html/General-Commands.html#General-Commands
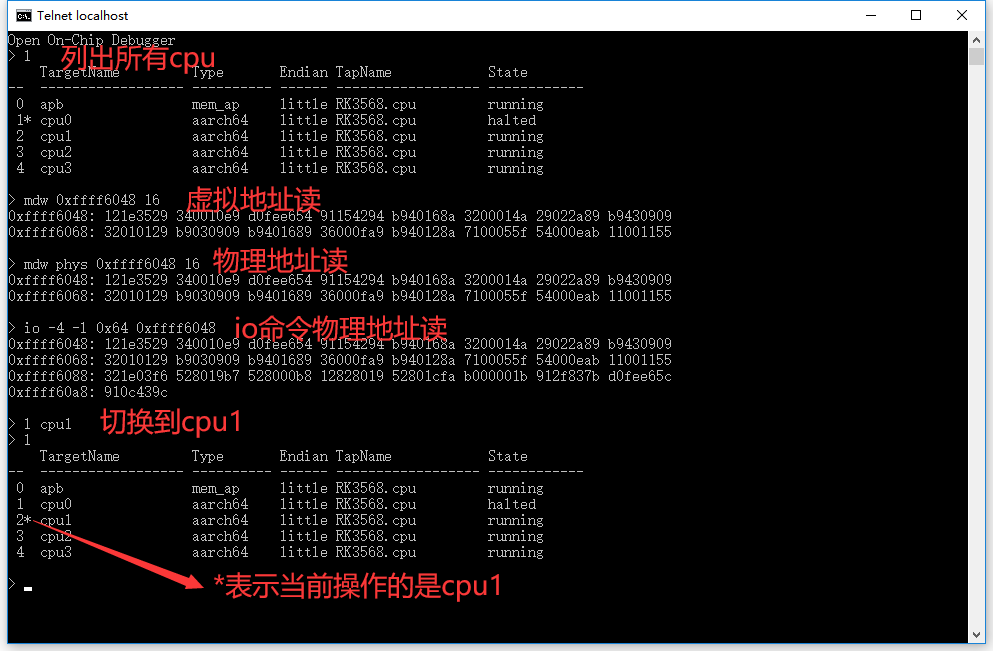
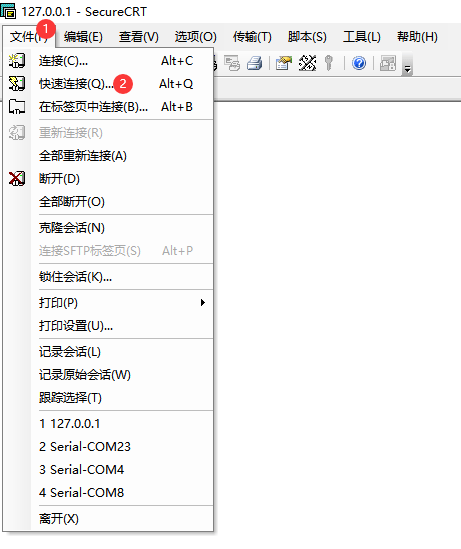
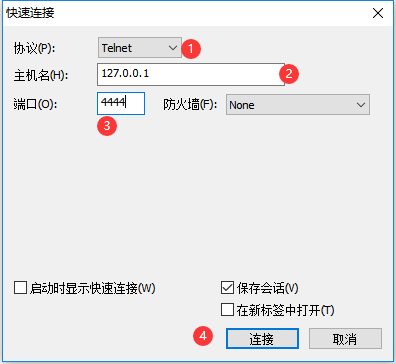
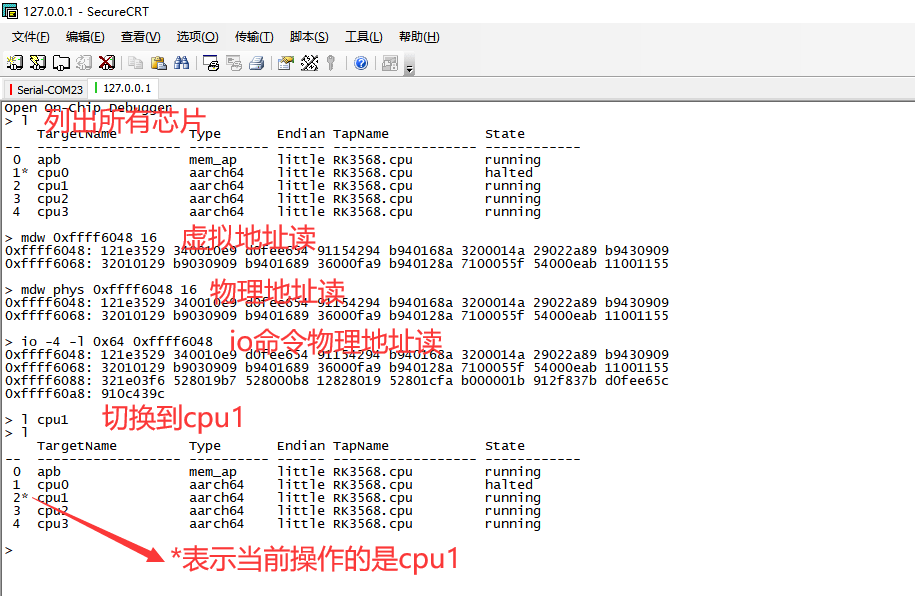
Open another cmd window and run telnet localhost 4444. Alternatively, establish a Telnet session using SecureCRT as shown.
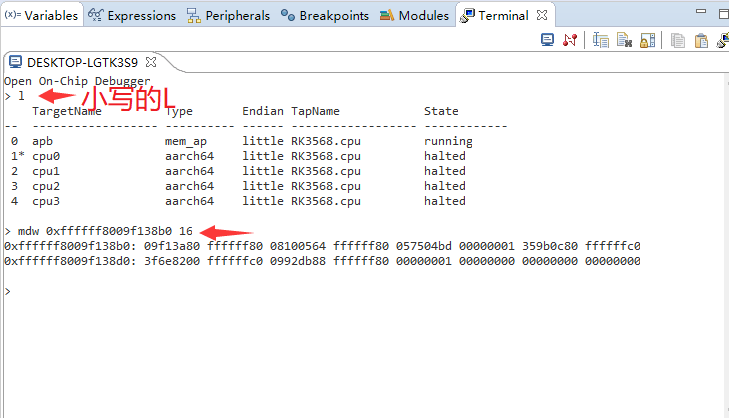
5.5 OpenOCD command mode in Eclipse
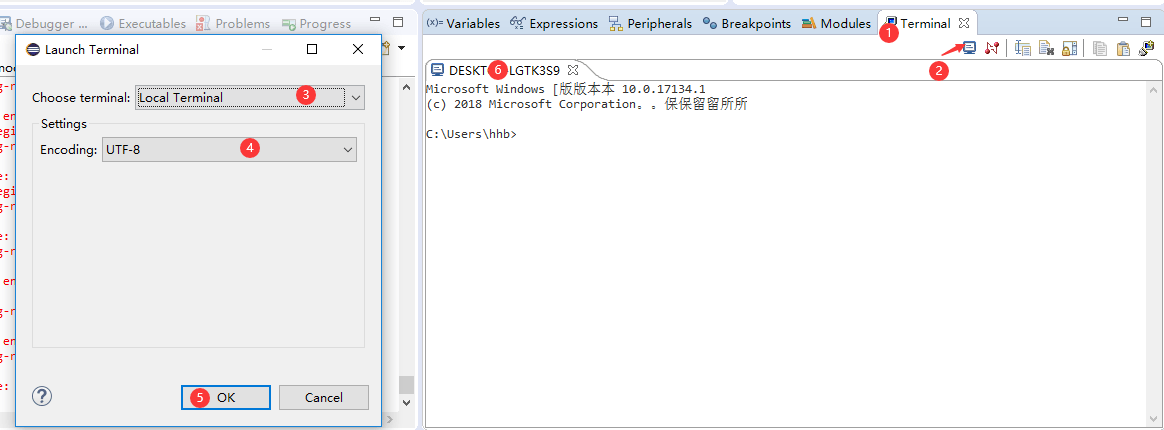
For information or operations not conveniently exposed by the UI, open a local terminal and enter telnet localhost 4444. If the command is unavailable, enable Windows Telnet as in §2.1.3.
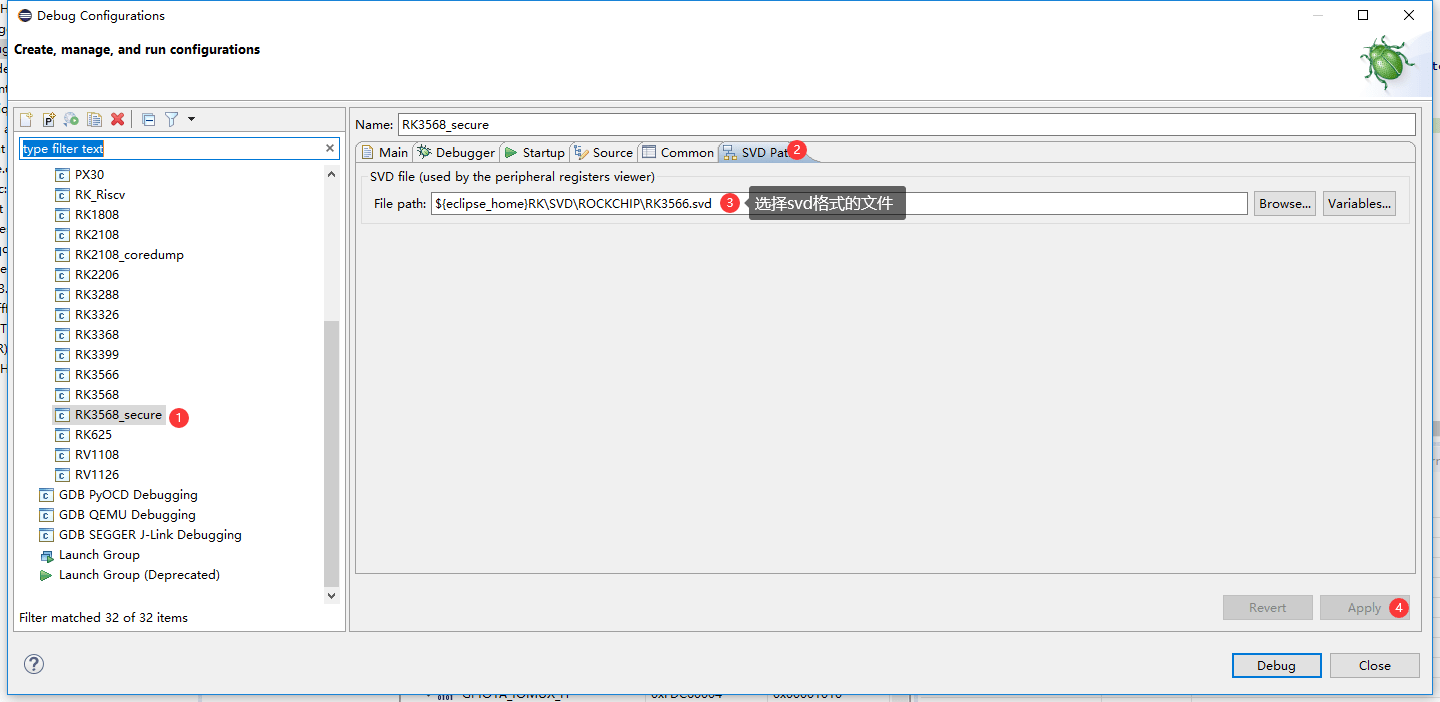
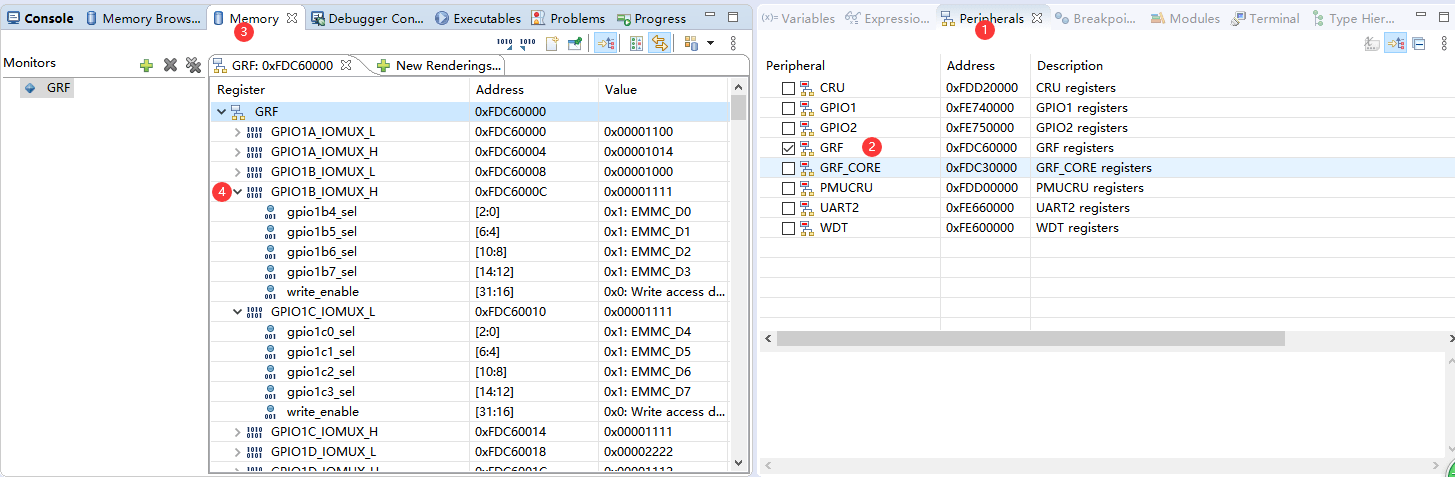
5.6 Visual peripheral-register view
Select an SVD file before connecting, then inspect registers as shown.
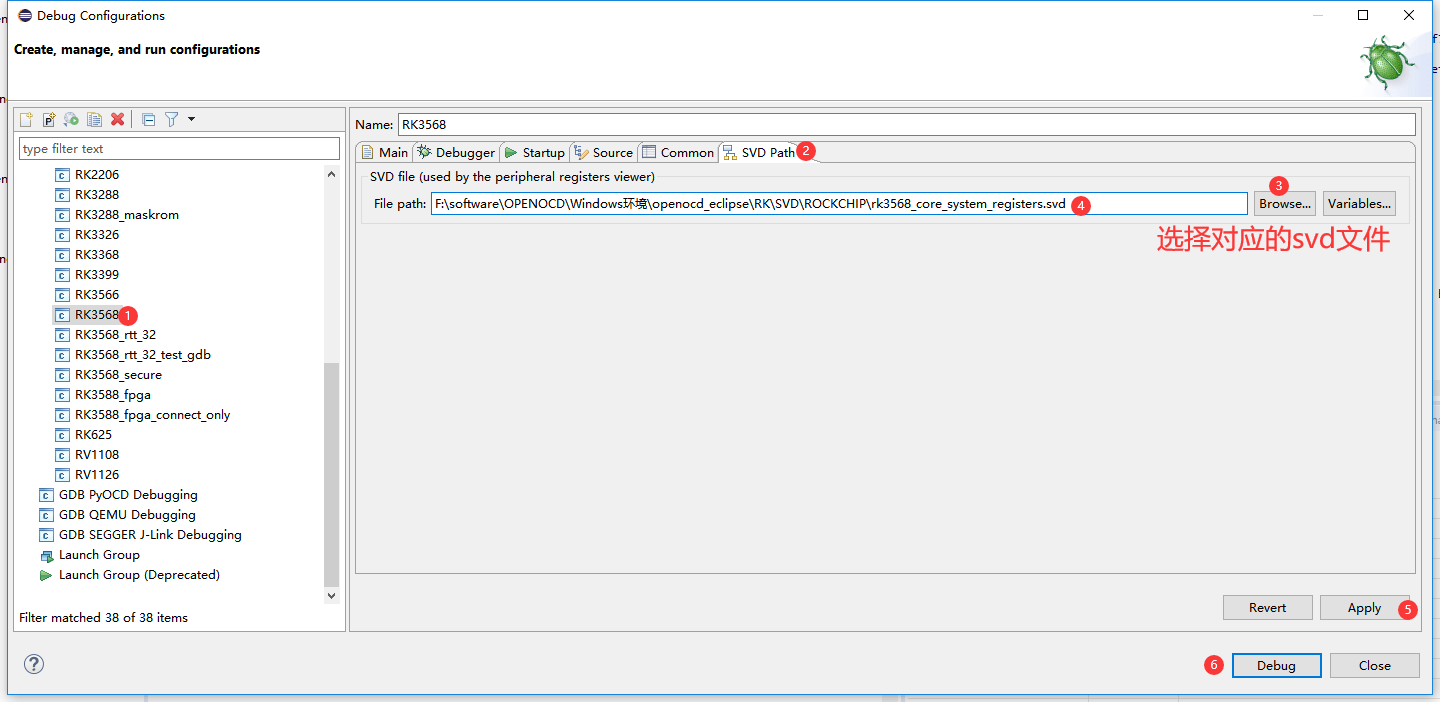
5.7 Visual system-control register view
Select the SVD file before connecting for this view as well.
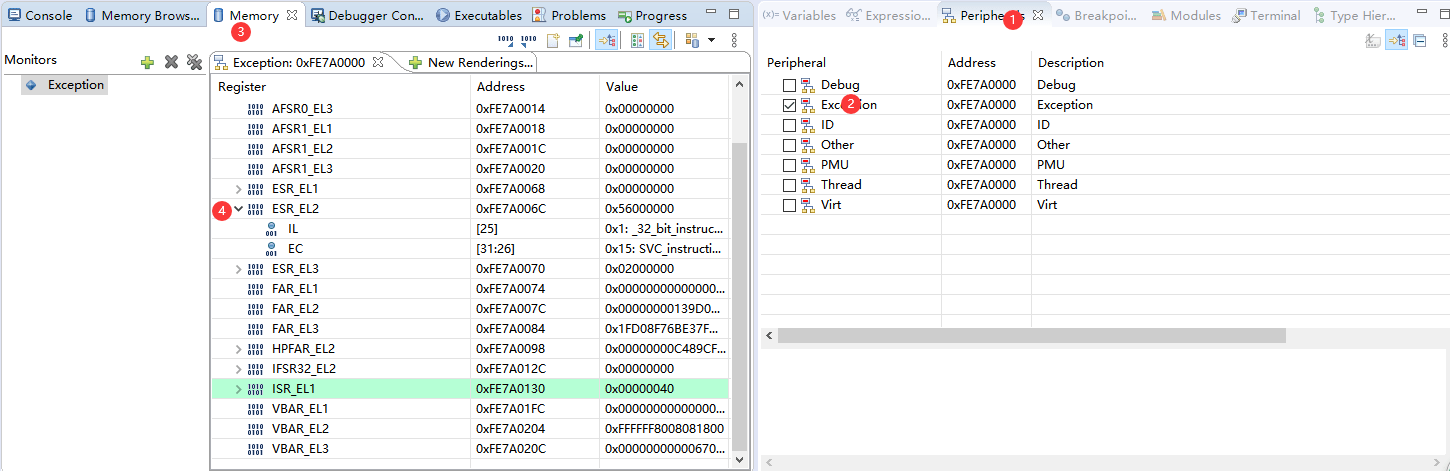
5.8 Exporting memory to a file
Syntax and source examples for virtual and physical addresses follow; p: denotes a physical address. Transfer speeds are source examples.
dump_image filename [p:]address size
 dump_image filename [p:]address size
 虚拟地址访问:

 > dump_image dd.bin 0xffffff8009a63c80 65536
 dumped 65536 bytes in 0.113187s (565.436 KiB/s)
 物理地址访问:
 > dump_image dd.bin p:0x01c63c80 65536
 dumped 65536 bytes in 0.094566s (676.776 KiB/s)
5.9 Importing a file into memory
load_image filename [p:]address ['bin'|'ihex'|'elf'|'s19'] [min_address] [max_length]
 load_image filename [p:]address ['bin'|'ihex'|'elf'|'s19'] [min_address]
 [max_length]
 虚拟地址访问:

 > load_image dd.bin 0xffffff8009a63c80 bin
 65536 bytes written at address 0xffffff8009a63c80
 downloaded 65536 bytes in 0.055928s (1144.328 KiB/s)
 物理地址访问:
 > load_image dd.bin p:0x01c63c80 bin
 65536 bytes written at address 0x01c63c80
 downloaded 65536 bytes in 0.056400s (1134.752 KiB/s)
5.10 Comparing a file with memory
verify_image supports only virtual-address access.
verify_image filename [offset [type]]
 verify_image filename [offset [type]]
 只⽀持虚拟地址访问:
 > verify_image dd.bin 0xffffff8009a63c80

 verified 65536 bytes in 0.066775s (958.443 KiB/s)
These three commands involve virtual and physical addresses. The source treats them as identical in maskrom, TPL, SPL, U-Boot and ATF, so virtual-address access suffices there. In Linux they differ; prefix physical addresses with p:. A relative filename such as dd.bin is resolved in OpenOCD’s working directory. Actual mappings still depend on the target’s runtime state.
6. Practical scenarios
6.1 Investigating CPU lockups
A frozen display, black screen, unresponsive serial console or kernel errors can indicate a CPU stuck at one or more instructions. The source example is an RK3399 boot lockup: logs stop, the serial console is unresponsive and the display does not update. The complete source logs follow.
 [  7.441882] type=1400 audit(1501952314.540:9): avc: denied { setattr } for
 pid=1 comm="init" name="mmcblk1p13" dev="tmpfs" ino=15288 scontext=u:r:init:s0
 tcontext=u:object_r:block_device:s0 tclass=lnk_file permissive=1

 [  7.455950] init: Service 'exec 2 (/system/bin/vdc)' (pid 252) exited with
 status 0
 rk3399_all:/ $ [ 7.589883] random: nonblocking pool is initialized
 [  8.078474] init: Starting service 'bootanim'...
 [  8.261358] read channel() error: -110
 [  15.245727] BUG: spinlock lockup suspected on CPU#2, adbd/251
 $ ./src/openocd.exe -r rk3399
 Open On-Chip Debugger 0.10.0+dev-01555-g6ad367fa3-dirty (2021-08-04-17:44)

 Licensed under GNU GPL v2
 For bug reports, read
       http://openocd.org/doc/doxygen/bugs.html
 中间省掉很多log
 Info : clock speed 2000 kHz
 Info : SWD DPIDR 0x5ba02477
 Info : cpu0: hardware has 6 breakpoints, 4 watchpoints
 Info : cpu1: hardware has 6 breakpoints, 4 watchpoints
 Info : cpu2: hardware has 6 breakpoints, 4 watchpoints
 Info : cpu3: hardware has 6 breakpoints, 4 watchpoints
 Info : cpu4: hardware has 6 breakpoints, 4 watchpoints
 Info : cpu5: hardware has 6 breakpoints, 4 watchpoints

 Info : starting gdb server for cpu0 on 3333
 Info : Listening on port 3333 for gdb connections
 Info : starting gdb server for cpu1 on 3334
 Info : Listening on port 3334 for gdb connections
 Info : starting gdb server for cpu2 on 3335
 Info : Listening on port 3335 for gdb connections
 Info : starting gdb server for cpu3 on 3336
 Info : Listening on port 3336 for gdb connections
 Info : starting gdb server for cpu4 on 3337
 Info : Listening on port 3337 for gdb connections
 Info : starting gdb server for cpu5 on 3338
 Info : Listening on port 3338 for gdb connections
Open another terminal and run telnet localhost 4444. cpu_block lists relevant commands; l lists CPU state, dump_pc samples PCs repeatedly, halt attempts to stop a CPU and fhalt is tried if it fails. After a successful forced halt, inspect core_reg64/core_reg32; the source warns that memory cannot be accessed in this state.
 另外再打开⼀个cmd窗⼝,输⼊telnet localhost 4444 进⼊命令⾏调试


 Open On-Chip Debugger
 > cpu_block 查看针对cpu卡死问题,有哪些命令可以⽤
 l 查看cpu状态
 dump_pc 多次打印pc指针
 halt 停住cpu
 if halt fail, try fhalt 强制cpu进⼊debug 状态
 if fhalt success, try core_reg64 or core_reg32, but you can't access memory
 > l
    TargetName    Type    Endian TapName    State
 -- ------------------ ---------- ------ ------------------ ------------
  0 ahb           mem_ap  little RK3399.cpu running
  1 apb           mem_ap  little RK3399.cpu running
  2* cpu0         aarch64 little RK3399.cpu running

  3 cpu1          aarch64 little RK3399.cpu running
  4 cpu2          aarch64 little RK3399.cpu running
  5 cpu3          aarch64 little RK3399.cpu running
  6 cpu4          aarch64 little RK3399.cpu running
  7 cpu5          aarch64 little RK3399.cpu running

 > dump_pc
 1
 cpu0 pc:0xffffff8008143a88
 cpu1 pc:0xffffff8008143a5c
 cpu2 pc:0xffffff8008081078
 cpu3 pc:0xffffff8008081078
 cpu4 pc:0xffffff80081133c8
 cpu5 pc:0xffffff800808248c
 2
 cpu0 pc:0xffffff8008143a88
 cpu1 pc:0xffffff8008143a5c
 cpu2 pc:0xffffff8008081078

 cpu3 pc:0xffffff8008081078
 cpu4 pc:0xffffff80081133c8
 cpu5 pc:0xffffff800808248c
 3
 cpu0 pc:0xffffff8008143a88
 cpu1 pc:0xffffff8008143a5c
 cpu2 pc:0xffffff8008081078
 cpu3 pc:0xffffff8008081078
 cpu4 pc:0xffffff80081133c8
 cpu5 pc:0xffffff800808248c
 4
 cpu0 pc:0xffffff8008143a88
 cpu1 pc:0xffffff8008143a5c

 cpu2 pc:0xffffff8008081078
 cpu3 pc:0xffffff8008081078
 cpu4 pc:0xffffff80081133c8
 cpu5 pc:0xffffff800808248c
 5
 cpu0 pc:0xffffff8008143a88
 cpu1 pc:0xffffff8008143a5c
 cpu2 pc:0xffffff8008081078
 cpu3 pc:0xffffff8008081078
 cpu4 pc:0xffffff80081133c8
 cpu5 pc:0xffffff800808248c 经过5次打印,发现6个cpu的pc指针都没变,那么很可能是卡死了


 > halt
 Timeout waiting for target cpu0 halt 第⼀次尝试停cpu0失败

 > fhalt
 cpu0 fail to force entry to debug state; prsr:00000001 第⼆次尝试停cpu0失败,这时只能
 根据打印出来的pc指针来查问题了

 > l cpu1

 > halt
 Timeout waiting for target cpu1 halt

 > fhalt

 cpu1 fail to force entry to debug state; prsr:00000001
 > l cpu2
 > halt
 Timeout waiting for target cpu2 halt

 > fhalt

 cpu2 success to force entry to debug state; prsr:00000011 终于可以停住cpu2

 > core_reg64 可以打印cpu通⽤寄存器,以便进⼀步分析
 x0 (/64): 0xffffffc00a3d7e00
 x1 (/64): 0xffffff8008081028
 x2 (/64): 0x0000000000000000
 x3 (/64): 0x00000040edbb6000
 x4 (/64): 0x0100000000000000
 x5 (/64): 0x000000000d8031bf
 x6 (/64): 0x000000000000126a
 x7 (/64): 0xffffff8008141ee0
 x8 (/64): 0x0000000000000000

 x9 (/64): 0x0000000000000000
 x10 (/64): 0x00000000000012b0
 x11 (/64): 0x000000000000000f
 x12 (/64): 0x0000000100000000
 x13 (/64): 0x0000000000000001
 x14 (/64): 0x0000000000000000
 x15 (/64): 0x0000000000000000
 x16 (/64): 0xffffff80080b8b28
 x17 (/64): 0x0000007cf3aeee00
 x18 (/64): 0x0000000000000000
 x19 (/64): 0x000000000000001e
 x20 (/64): 0x0000008000000000
 x21 (/64): 0xffffff80094e7990

 x22 (/64): 0xffffff8009357ea0
 x23 (/64): 0xffffffc00a3d7e00
 x24 (/64): 0x0000000000000001
 x25 (/64): 0xffffffc0f6ed4060
 x26 (/64): 0xffffffc0f6ed8050
 x27 (/64): 0x0000000000ed9234
 x28 (/64): 0xffffffc00a3cad00
 x29 (/64): 0xffffffc0f6ed8000
 x30 (/64): 0xffffff8008083230
 sp (/64): 0xffffffc0f6ed8000
 pc (/64): 0xffffff800808107c


 > mrs SCTLR_EL1 也可以读system control寄存器
 Cannot reach EL 0, SPSR corrupted?
 SCTLR_EL1:0x34d5d91d

 > mrs SCTLR_EL2
 Cannot reach EL 0, SPSR corrupted?
 SCTLR_EL2:0x30c50830

 > mrs SCTLR_EL3
 Cannot reach EL 0, SPSR corrupted?
 SCTLR_EL3:0x00cd383f
In the example, all six CPUs retain the same PCs across five samples, suggesting a lockup. Forced halts fail for CPU0/CPU1 and succeed for CPU2. core_reg64 prints general-purpose registers and mrs SCTLR_EL1/EL2/EL3 reads system-control registers. Run objdump.exe -d vmlinux | less to find the function and instruction at the PC. The source marks CPU2 at dsb sy, address 0xffffff800808107c.
 执⾏objdump.exe -d vmlinux | less,反汇编查看pc指针所处的函数和指令

 ffffff8008081028 <gic_handle_irq>:
 ffffff8008081028: a9bc7bfd   stp   x29, x30, [sp, #-64]!
 ffffff800808102c: 910003fd   mov   x29, sp
 ffffff8008081030: a9025bf5   stp   x21, x22, [sp, #32]

 ffffff8008081034: d00096b6   adrp  x22, ffffff8009357000
 <event_hash+0x288>
 ffffff8008081038: a90363f7   stp   x23, x24, [sp, #48]
 ffffff800808103c: d000a335   adrp  x21, ffffff80094e7000
 <event_class_drv_config+0x40>
 ffffff8008081040: aa0003f7   mov   x23, x0
 ffffff8008081044: 913a82d6   add   x22, x22, #0xea0
 ffffff8008081048: 912642b5   add   x21, x21, #0x990
 ffffff800808104c: a90153f3   stp   x19, x20, [sp, #16]
 ffffff8008081050: 52800038   mov   w24, #0x1
 // #1
 ffffff8008081054: d503201f   nop

 ffffff8008081058: 14000008   b     ffffff8008081078
 <gic_handle_irq+0x50>
 ffffff800808105c: 71003e7f   cmp   w19, #0xf
 ffffff8008081060: 540007e8   b.hi  ffffff800808115c
 <gic_handle_irq+0x134> // b.pmore
 ffffff8008081064: 92407e60   and   x0, x19, #0xffffffff
 ffffff8008081068: d518cc20   msr   s3_0_c12_c12_1, x0
 ffffff800808106c: d5033fdf   isb
 ffffff8008081070: d503201f   nop
 ffffff8008081074: 14000035   b     ffffff8008081148
 <gic_handle_irq+0x120>
 ffffff8008081078: d538cc13   mrs   x19, s3_0_c12_c12_0
 *ffffff800808107c: d5033f9f   dsb  sy   cpu2卡死在这个位置

 ffffff8008081080: 51004260   sub   w0, w19, #0x10
 ffffff8008081084: 2a1303f4   mov   w20, w19
 ffffff8008081088: 710fac1f   cmp   w0, #0x3eb
 ffffff800808108c: 54000089   b.ls  ffffff800808109c
 <gic_handle_irq+0x74> // b.plast
 ffffff8008081090: 5283ffe0   mov   w0, #0x1fff
 // #8191
 ffffff8008081094: 6b00027f   cmp   w19, w0
 ffffff8008081098: 54fffe29   b.ls  ffffff800808105c
 <gic_handle_irq+0x34> // b.plast
If the cause remains unclear, the source recommends providing these command logs to Rockchip engineers for analysis.
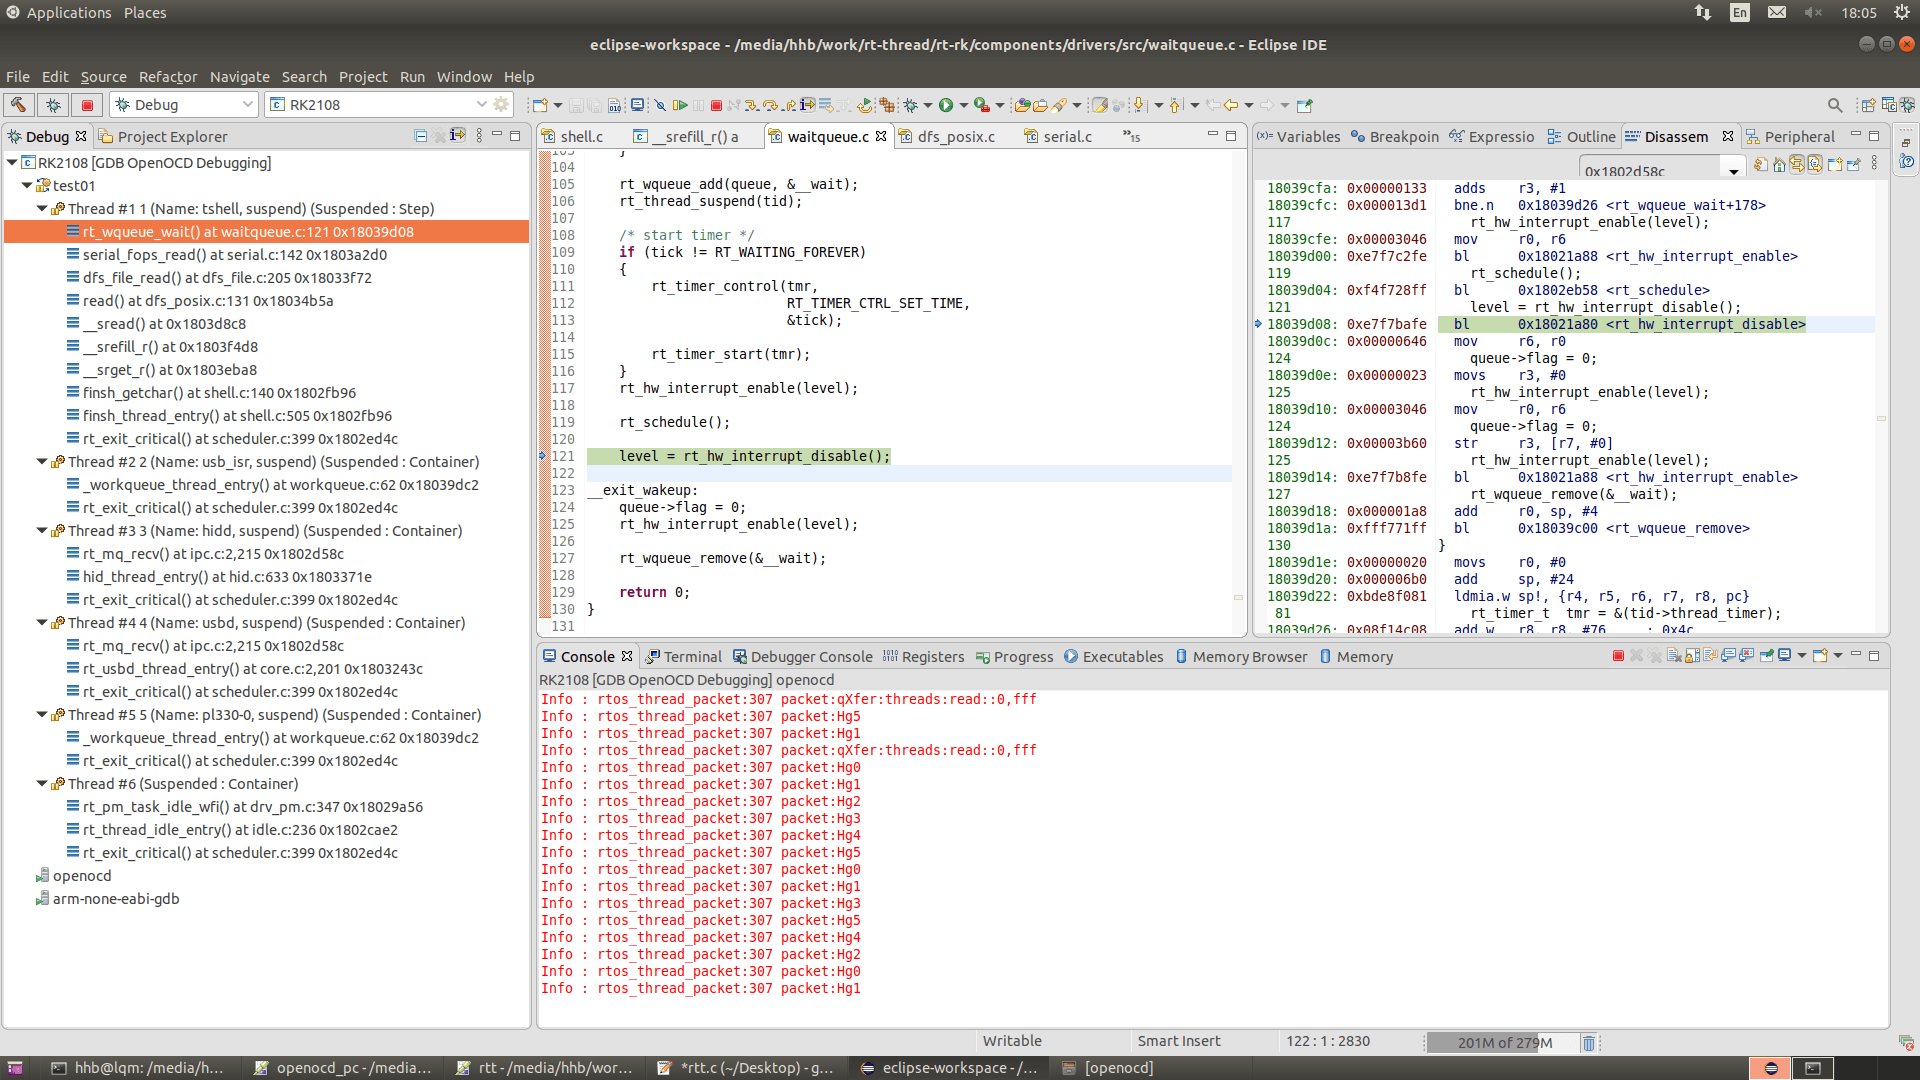
6.2 RT-Thread debugging
Only one thread is displayed by default. Add the following to display multiple threads:
-c "cpu0 configure -rtos RT_Thread"
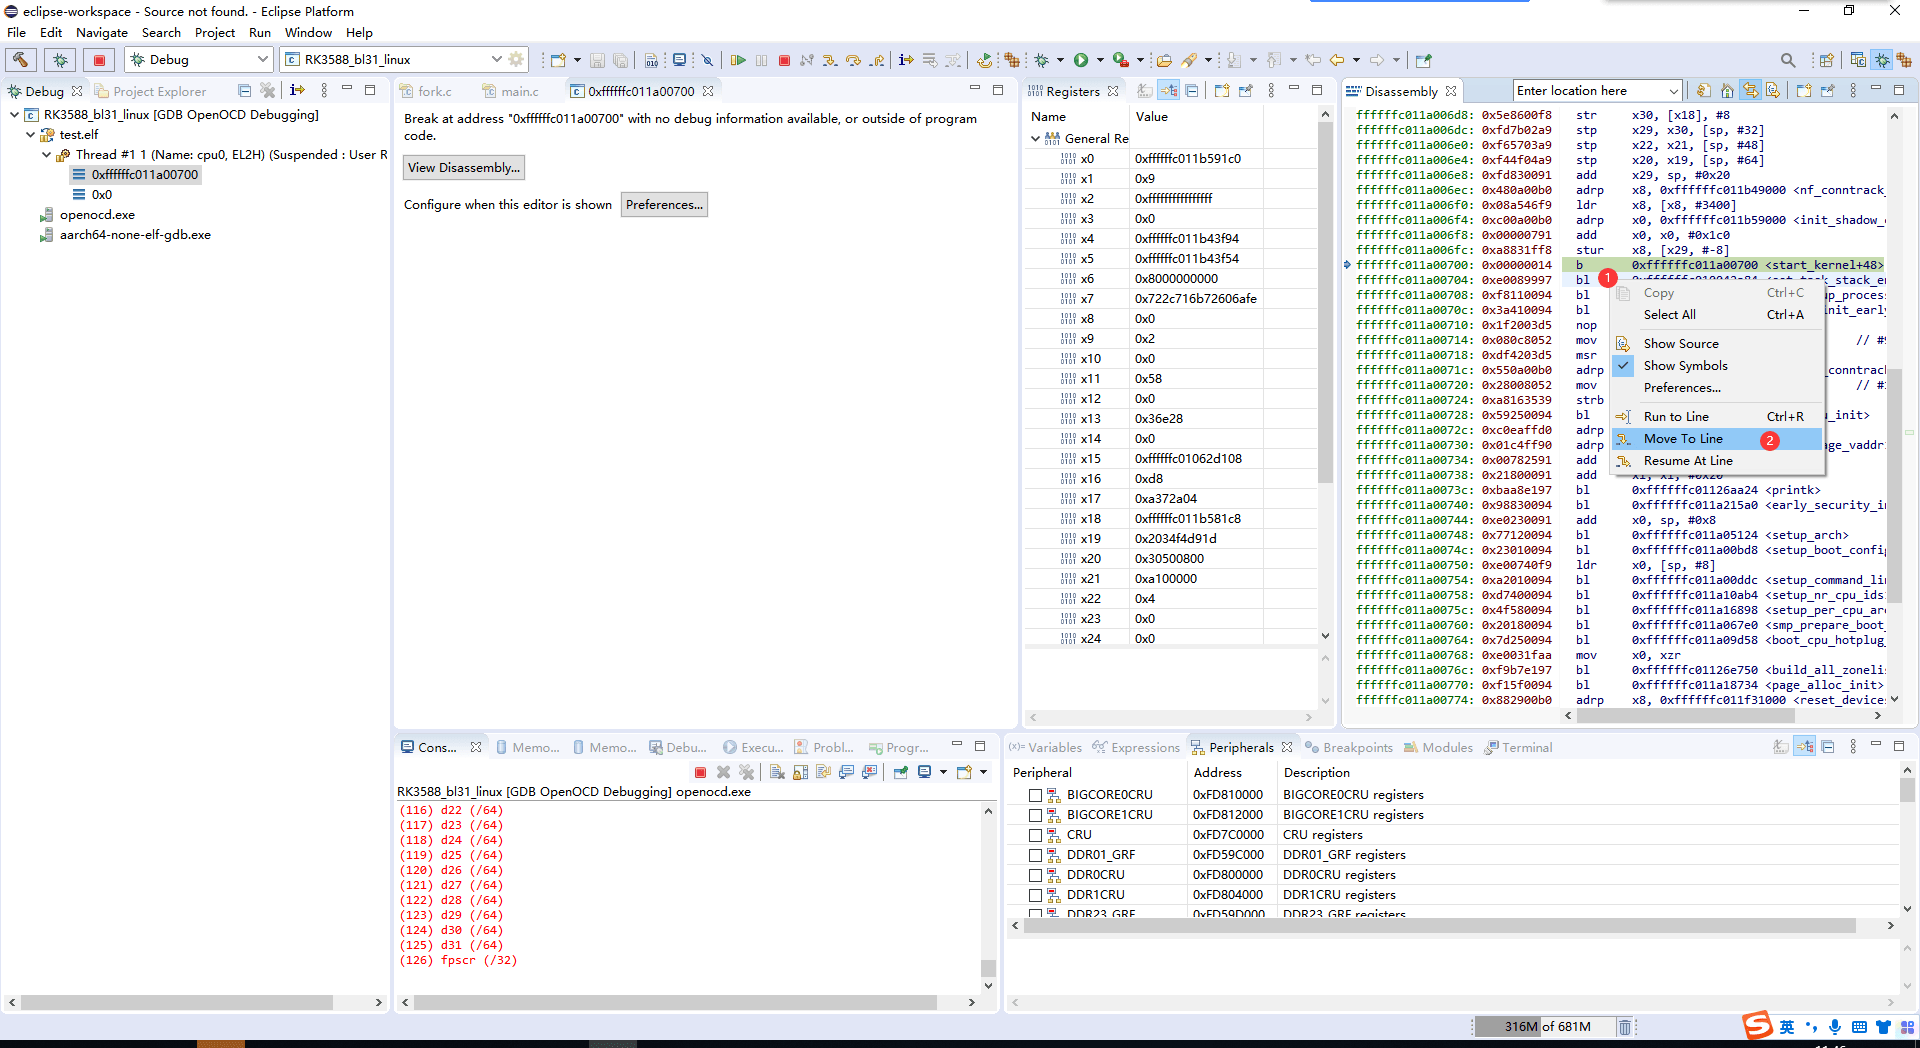
6.3 Single-stepping Linux
If kernel boot produces no logs after serial-port problems are ruled out, investigate an early-boot failure. The following insert a self-loop to pause execution. They deliberately block boot and must not remain in production images.
6.3.1 Single-core kernel stage
Modify linux5.10/init/main.c. Right-click the instruction after b ., select Move To line to skip the loop, then single-step.
 linux5.10/init/main.c
 asmlinkage __visible void __init __no_sanitize_address start_kernel(void)

 {
    char *command_line;
    char *after_dashes;
    asm volatile("b .");
  ...
  }
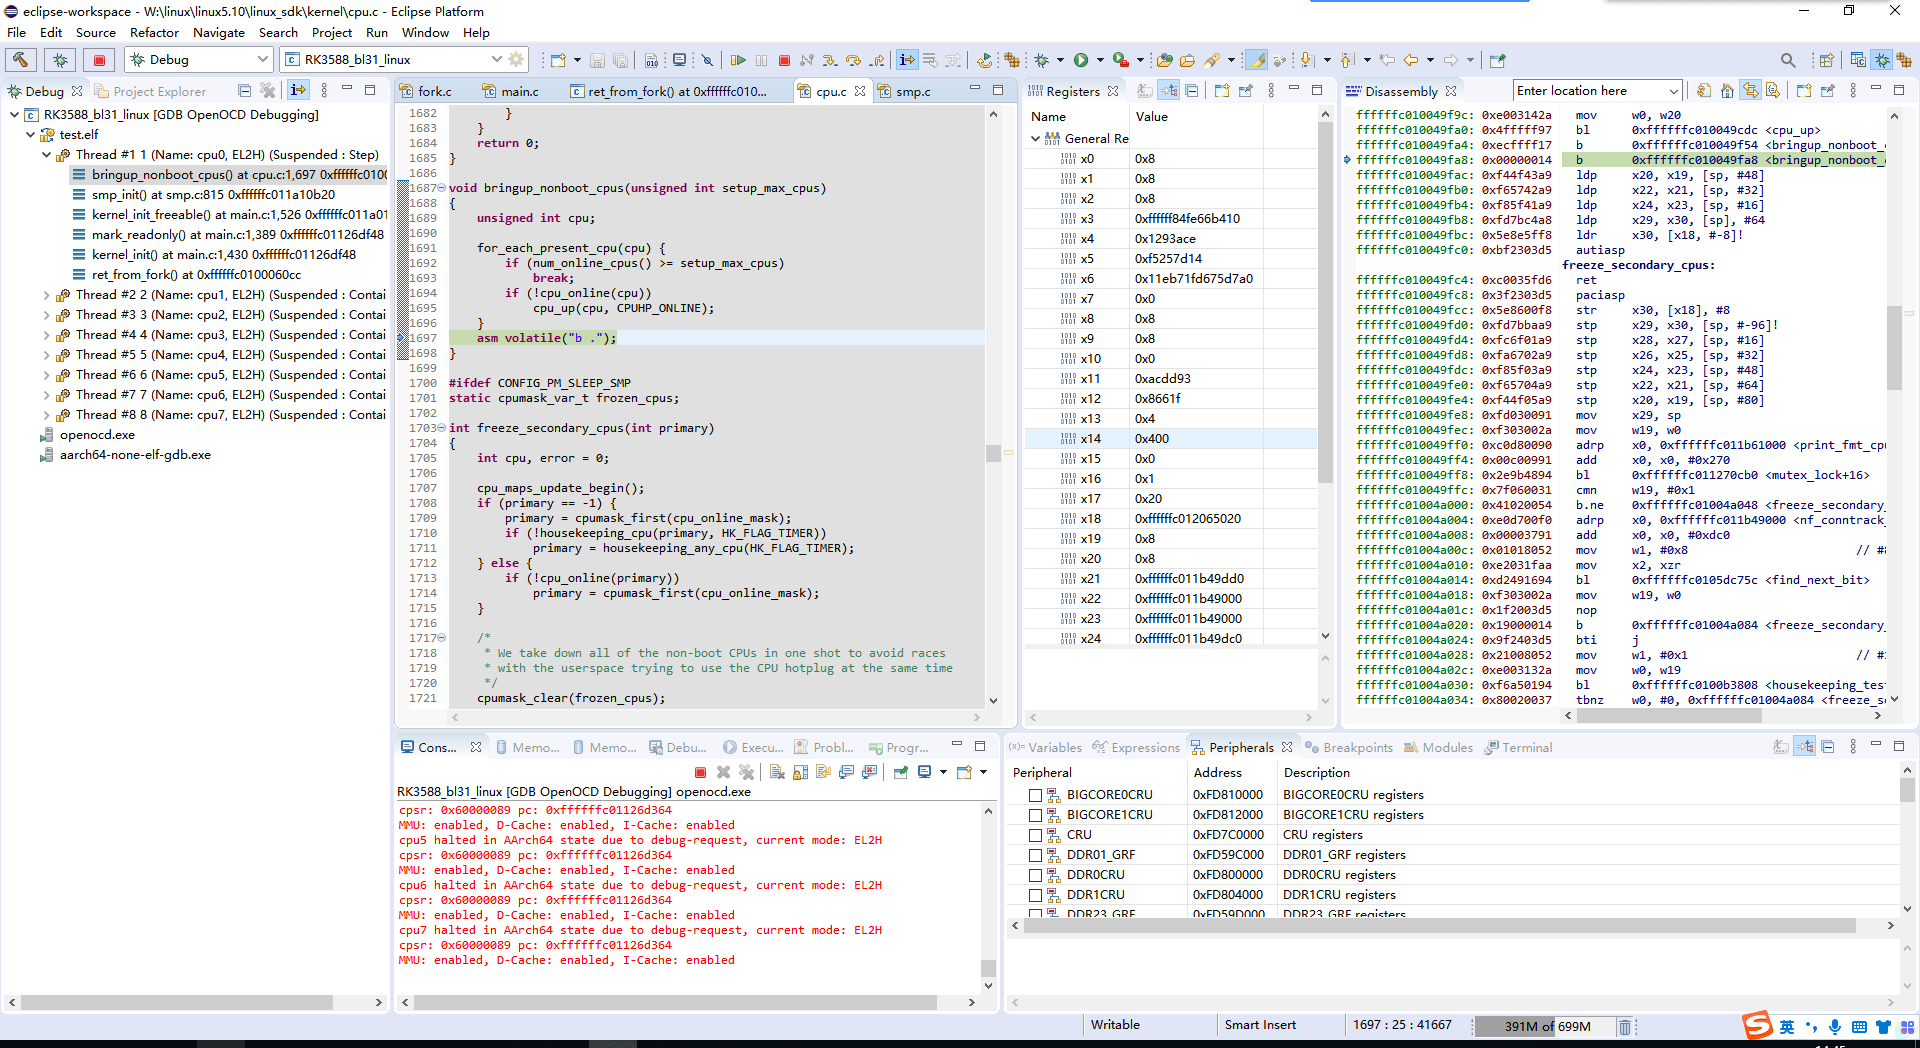
6.3.2 Multicore kernel stage
Modify linux5.10/kernel/cpu.c:
 linux5.10/kernel/cpu.c
 void bringup_nonboot_cpus(unsigned int setup_max_cpus)

 {
    unsigned int cpu;

    for_each_present_cpu(cpu) {
       if (num_online_cpus() >= setup_max_cpus)
          break;
       if (!cpu_online(cpu))
          cpu_up(cpu, CPUHP_ONLINE);
    }
    asm volatile("b .");
 }
6.4 Bare-metal debugging
6.4.1 Creating a project
Create a project using the standard Eclipse workflow, then configure compiler options and the cross-compiler.
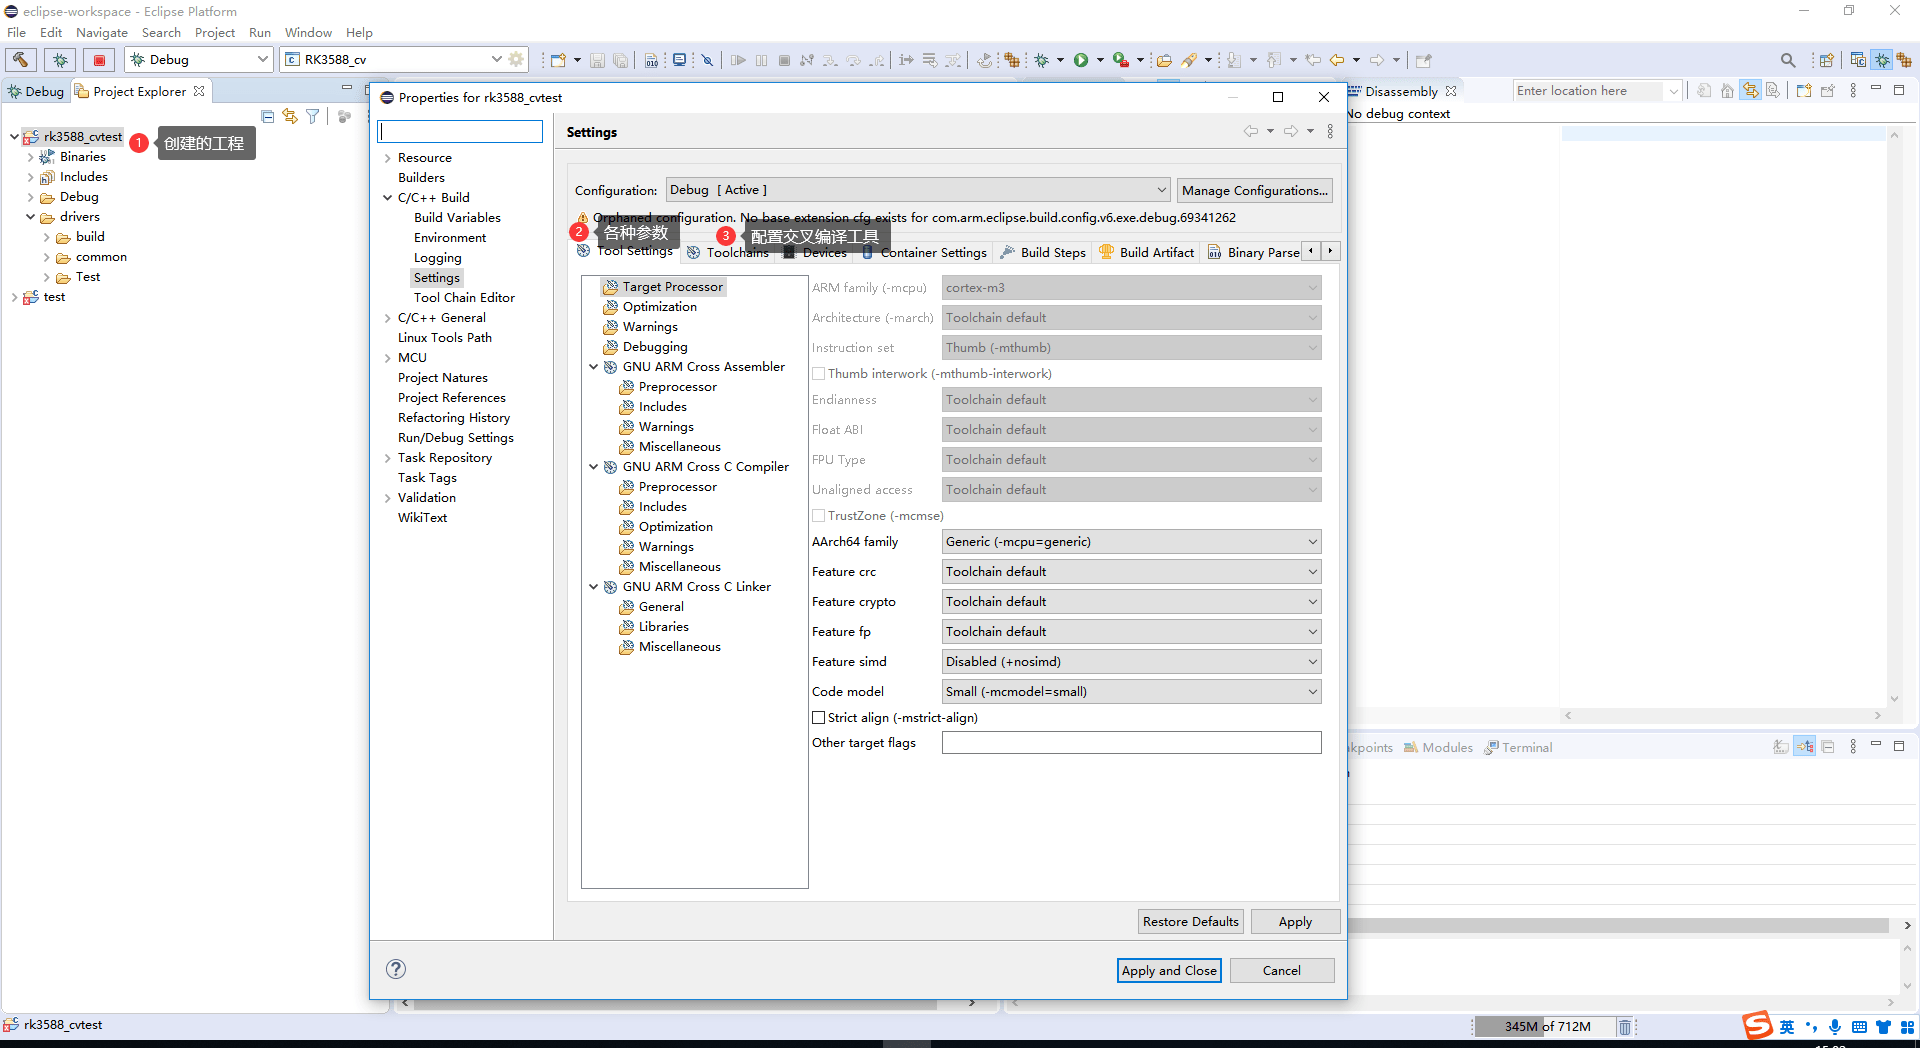
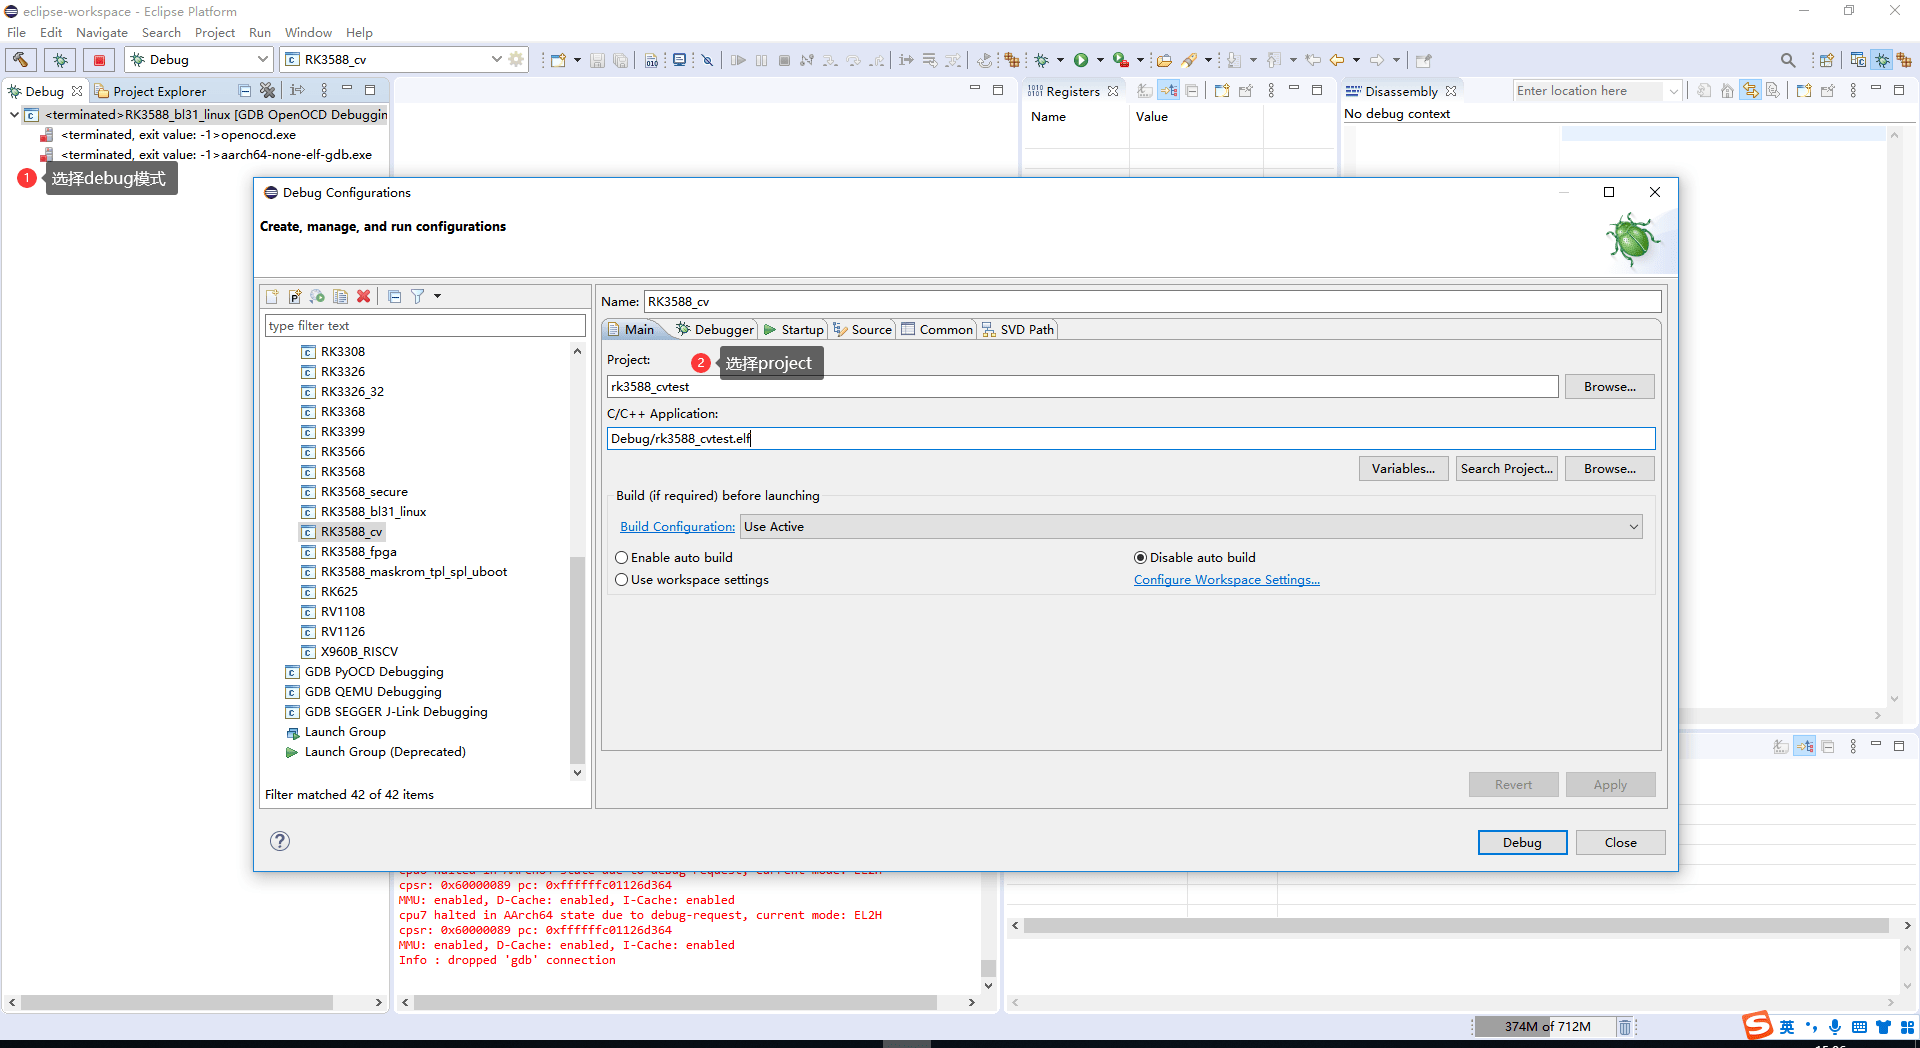
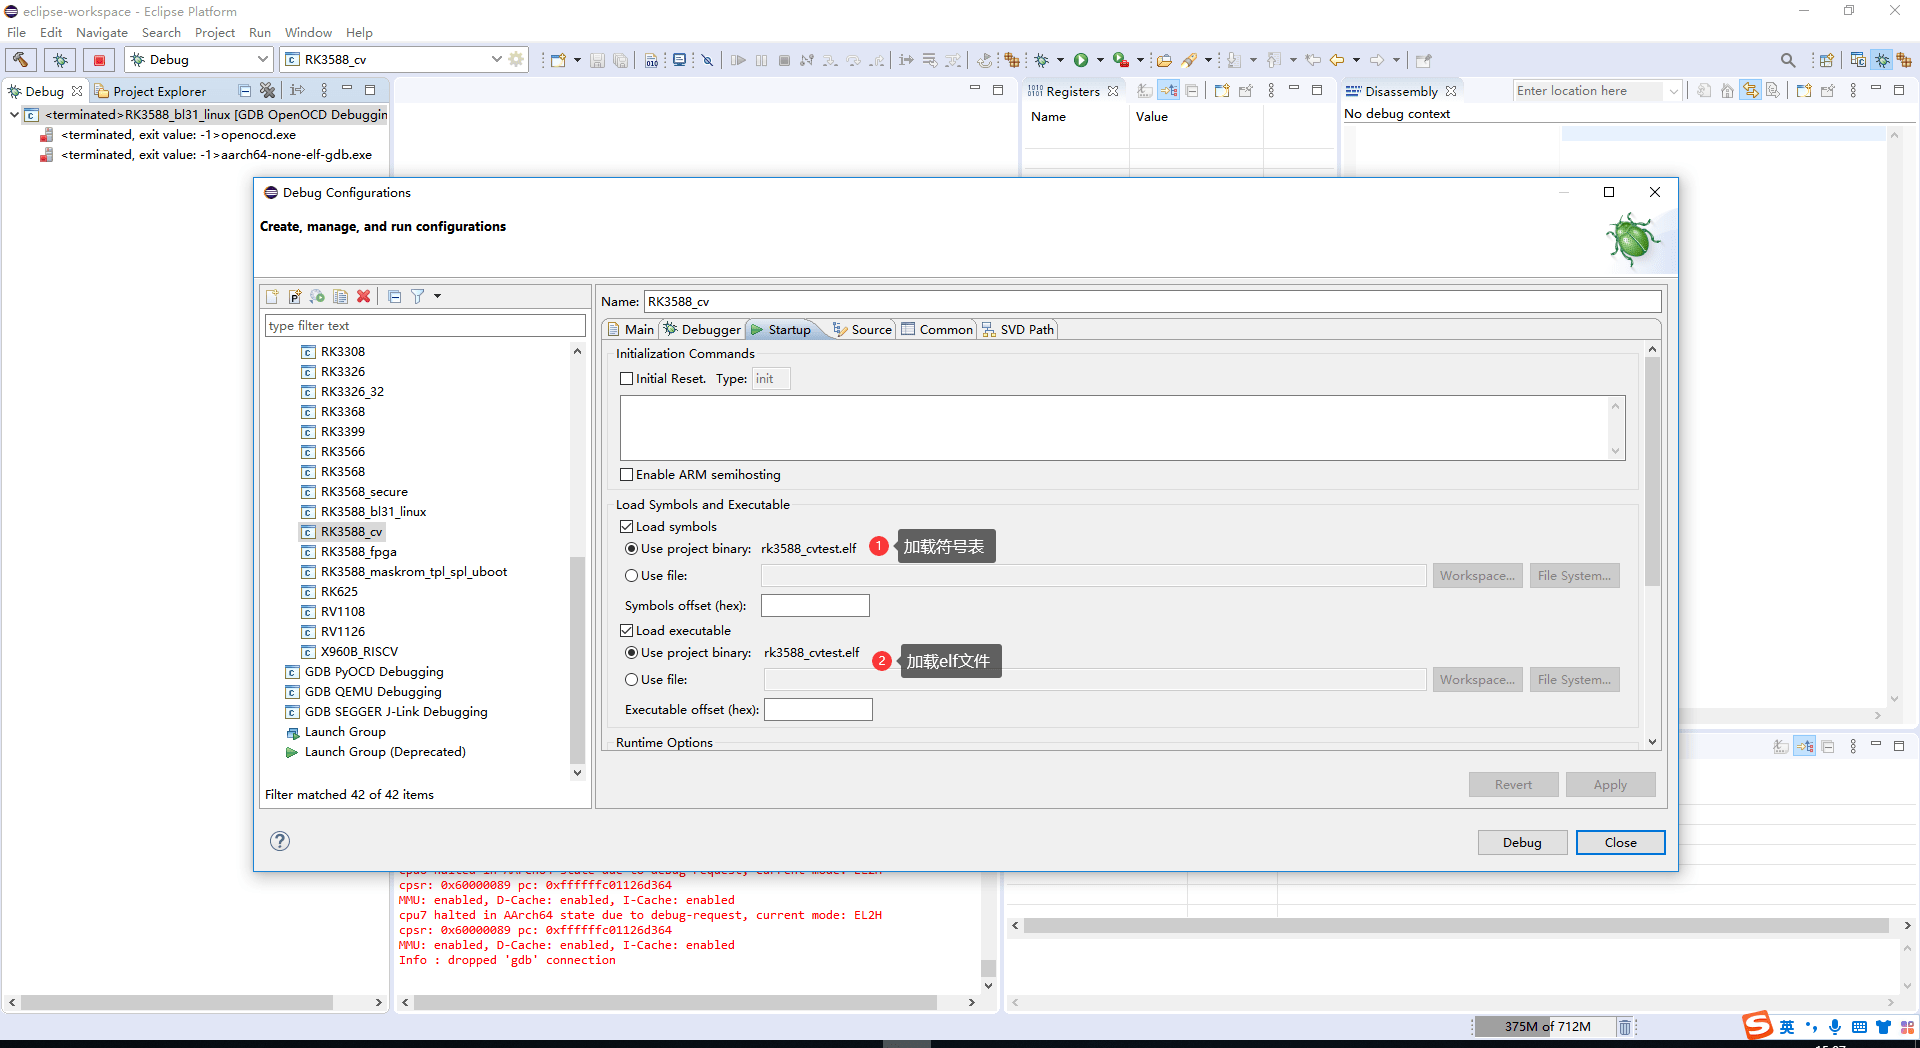
6.4.2 Loading and running firmware
Copy the target chip’s configuration first, then modify the copy for debugging.
6.5 Using KGDB
6.5.1 Purpose
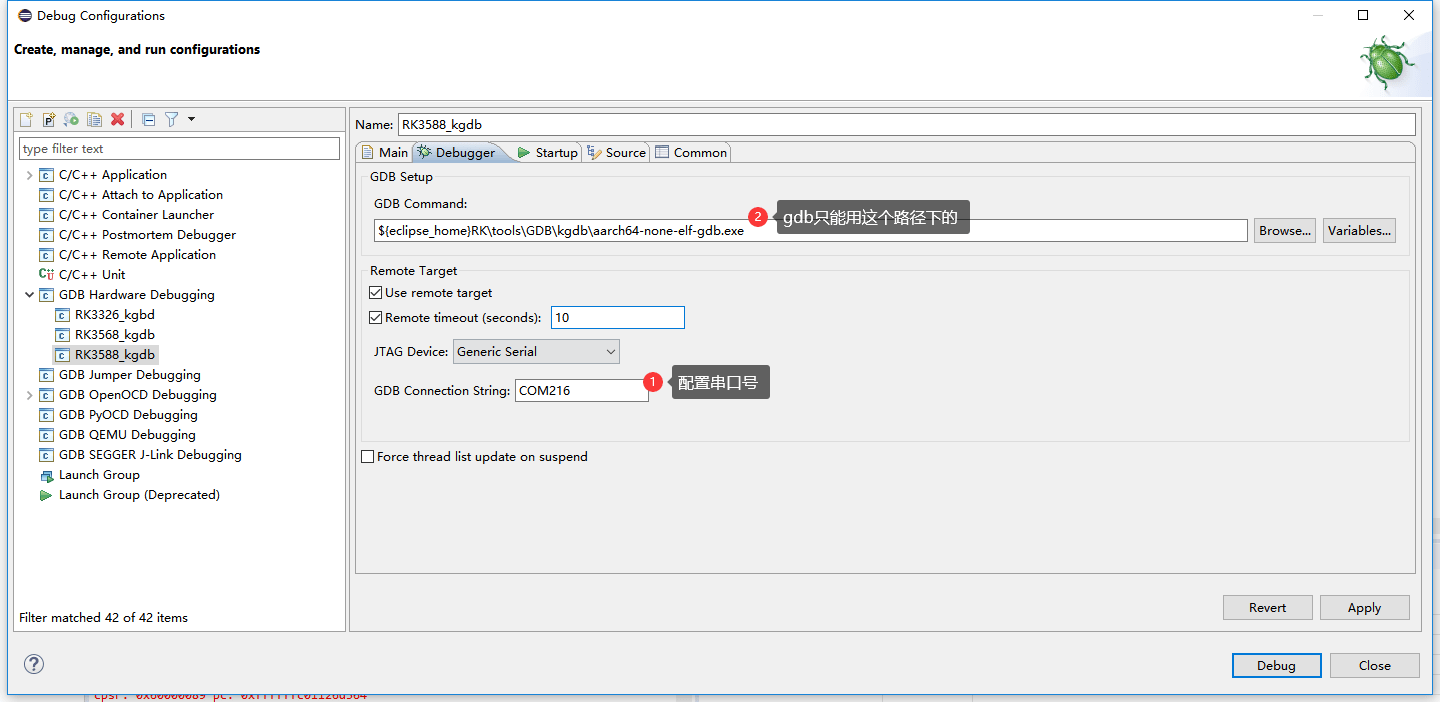
Use KGDB for driver debugging and full call-stack backtraces after invalid-pointer faults. It communicates over serial rather than JTAG.
6.5.2 Enabling KGDB
Apply the source menuconfig settings. Set panic timeout to 0 so a die event enters KGDB instead of rebooting. Alternatively use echo 0 > /sys/module/kernel/parameters/panic.
 Device Drivers --->
   Character devices --->
     [*]  Virtual terminal

         [*]   Enable character translations in console (NEW)
         [*]   Support for console on virtual terminal (NEW)
 -> Kernel hacking
  -> Generic Kernel Debugging Instruments
    [*] KGDB: kernel debugger --->
     --- KGDB: kernel debugger
     [*]  KGDB: use kprobe blocklist to prohibit unsafe breakpoints (NEW)
     <*>  KGDB: use kgdb over the serial console (NEW)

 Kernel hacking --->
   Debug Oops, Lockups and Hangs --->
    (0) panic timeout 这个要配成0,出现die时才会进⼊kgdb

  或者echo 0 > /sys/module/kernel/parameters/panic 将panic timeout时间设为0,即
 不reboot
The kernel configuration example is in arch/arm64/boot/dts/rockchip/rk3588-android.dtsi:
 arch/arm64/boot/dts/rockchip/rk3588-android.dtsi
 chosen {
    bootargs = "kgdboc_earlycon kgdboc=ttyFIQ0,1500000";

 };
The source checks activation with echo g > /proc/sysrq-trigger; the log ends by waiting for a remote debugger:
 echo g > /proc/sysrq-trigger

 [  1.385017][ T0] kgdboc: No suitable earlycon yet, will try later

 [  1.385069][ T0] earlycon: uart8250 at MMIO32 0x00000000feb50000
 (options '')
 [  1.390726][ T0] printk: bootconsole [uart8250] enabled
 [  2.956193][ T0] kgdboc: Going to register kgdb with earlycon 'uart'
 [  2.956196][ T0] KGDB: Registered I/O driver kgdboc_earlycon
 [  3.092139][ T1] Unable to handle kernel NULL pointer dereference at
 virtual address 000000000000007f
 [  3.093010][ T1] Mem abort info:
 [  3.093329][ T1] ESR = 0x96000005
 [  3.093672][ T1] EC = 0x25: DABT (current EL), IL = 32 bits
 [  3.094219][ T1] SET = 0, FnV = 0
 [  3.094561][ T1] EA = 0, S1PTW = 0
 [  3.094912][ T1] Data abort info:

 [  3.095238][ T1] ISV = 0, ISS = 0x00000005
 [  3.095651][ T1] CM = 0, WnR = 0
 [  3.095987][ T1] [000000000000007f] user address but active_mm is
 swapper
 [  3.096633][ T1] Internal error: Oops: 96000005 [#1] PREEMPT SMP
 [  3.097206][ T1] KGDB: Waiting for remote debugger
6.5.3 KGDB configuration
6.6 Debugging AArch64 in 32-bit mode
-c "cpu0 aarch64_32 "
Editorial and environment notes
The cover version date differs from some log timestamps, and the chip list does not establish software versions. Commands such as -r, cpu_block, fhalt, core_reg64 and aarch64_32 may depend on Rockchip’s customized OpenOCD and are not guaranteed in upstream builds. JRE 8, old Ubuntu/PPA references and paths remain historical examples, not claims of current installability. All source figures are retained; their additional UI parameters refer to the older tool. Licenses, required attribution and original comments inside logs/code were not removed with cover notices. Full editorial record.