
本文依据《GNU MCU Eclipse OpenOCD》V2.0.0(RK-KF-YF-91),完整保留六章技术正文、命令、日志、示例及 53 张技术截图。只有中文 PDF(41 页),英文和俄文从中文全文翻译,三语均使用中文 PDF 原图,图注和 alt 本地化。原有代码、命令和日志中的注释保留;没有冒充英文原图。
这是旧版 Rockchip 定制调试工具的平台参考。原稿列出 RK3588、RK3568、RK3566、RK3399、RK3288、RK3368、RK3326、PX30、RK3308、RV1108、RV1126/RV1109/RV1106、RK2108、RK2206、RISCV,但内核版本列为空。不能将其解释为当前所有 BSP 或 ArmSoM 板卡都可直接使用。以 ArmSoM Sige7 的 RK3588 为例,仍需核对 JTAG/SWD 引出、IOMUX、电平、适配器、芯片配置脚本、符号表、SDK/BSP 和内核版本。未在 ArmSoM 硬件上验证。
原文产品版本表(内核版本空白按原文保留):
| 芯片名称 | 内核版本 |
|---|---|
| RK3588 | |
| RK3568 | |
| RK3566 | |
| RK3399 | |
| RK3288 | |
| RK3368 | |
| RK3326 | |
| PX30 | |
| RK3308 | |
| RV1108 | |
| RV1126/RV1109/RV1106 | |
| RK2108 | |
| RK2206 | |
| RISCV |
注意:下文的软件版本、安装源和路径属于原稿环境,不代表当前安装建议。调试可暂停 CPU、修改内存、触发 KGDB,须在获得授权、可恢复的测试设备上操作。本文未执行这些命令;原文速度、日志和故障现象均不是 ArmSoM 实测。
1. 说明
调试架构为 Eclipse CDT + GNU MCU Eclipse OpenOCD + Eclipse + GDB + OpenOCD + ftdi/jlink + SoC。Eclipse CDT 是 C/C++ Development Tooling;GNU MCU Eclipse OpenOCD 是连接 CDT、GDB、OpenOCD 的开源插件。Eclipse 可集成多种插件,ARM DS-5 也基于 Eclipse。GDB 是 GNU 调试器;OpenOCD 可适配 SWD/JTAG 适配器,支持 ARM、RISCV 等架构。原文使用 FT232H USB 转 SWD/JTAG 芯片作为适配器,称其速度快且稳定。
2. 操作系统环境
2.1 Windows
2.1.1 软件包 openocd_eclipse.zip
解压后进入主目录,运行 Eclipse_for_OpenOCD V1.0.exe 打开 Eclipse。RK 目录中:eclipse-workspace 是已设定的默认工作区;example 存放示例;tools 包含 GDB、JDK 等工具;实战视频 提供快速上手;OpenOCD 存放相关文件;SVD(CMSIS System View Description format)用于查看芯片寄存器;doc 是帮助文档。
2.1.2 安装 JRE
Eclipse 需要 JRE,原稿安装文件为 RK\tools\jdk_8.0.1310.11_64.exe。
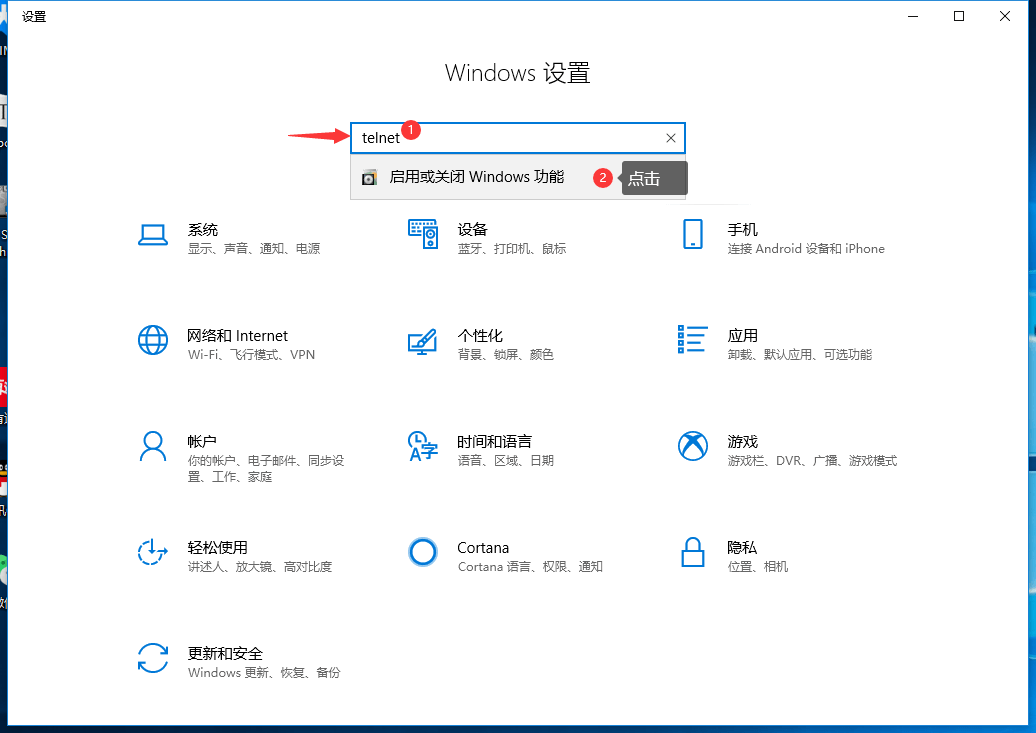
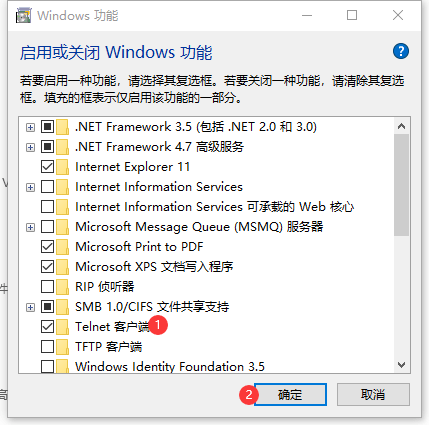
2.1.3 使能 Windows Telnet
Telnet 用于 OpenOCD 命令行模式。不同 Windows 版本入口可能不同,原图演示 Windows 10 的启用方法。
2.2 Ubuntu 64 位
2.2.1 软件包 openocd_eclipse.tar.gz
tar -xzvf openocd_eclipse.tar.gz
进入解压后的主目录,执行 eclipse。RK 下目录包括默认工作区 eclipse-workspace、示例 example、OpenOCD、寄存器描述 SVD、GDB 等工具所在的 tools、帮助 doc 和快速上手视频 实战视频。
2.2.2 安装依赖软件
运行 Eclipse 需要 JRE,原稿说明不一定要版本 8:
 sudo add-apt-repository ppa:openjdk-r/ppa
 sudo apt-get update
 sudo apt-get install openjdk-8-jre 这⾥不⼀定要8
OpenOCD 需要 libusb 和 libftdi:
 sudo apt-get install libusb-1.0-0-dev
 sudo apt-get install libftdi-dev
拷贝 USB 设备规则:
 sudo cp RK/OpenOCD/drivers/99-openocd.rules /etc/udev/rules.d/
 sudo cp RK/OpenOCD/drivers/60-openocd.rules /etc/udev/rules.d/
安装开源反汇编工具 Capstone。原文称在 Ubuntu 16.04、18.04 测试正常,这不是当前系统或 ArmSoM 的测试结果。
sudo apt-get install libcapstone-dev
3. 快速上手
Ubuntu 与 Windows 的 UI 基本一致,原稿主要使用 Windows 演示。
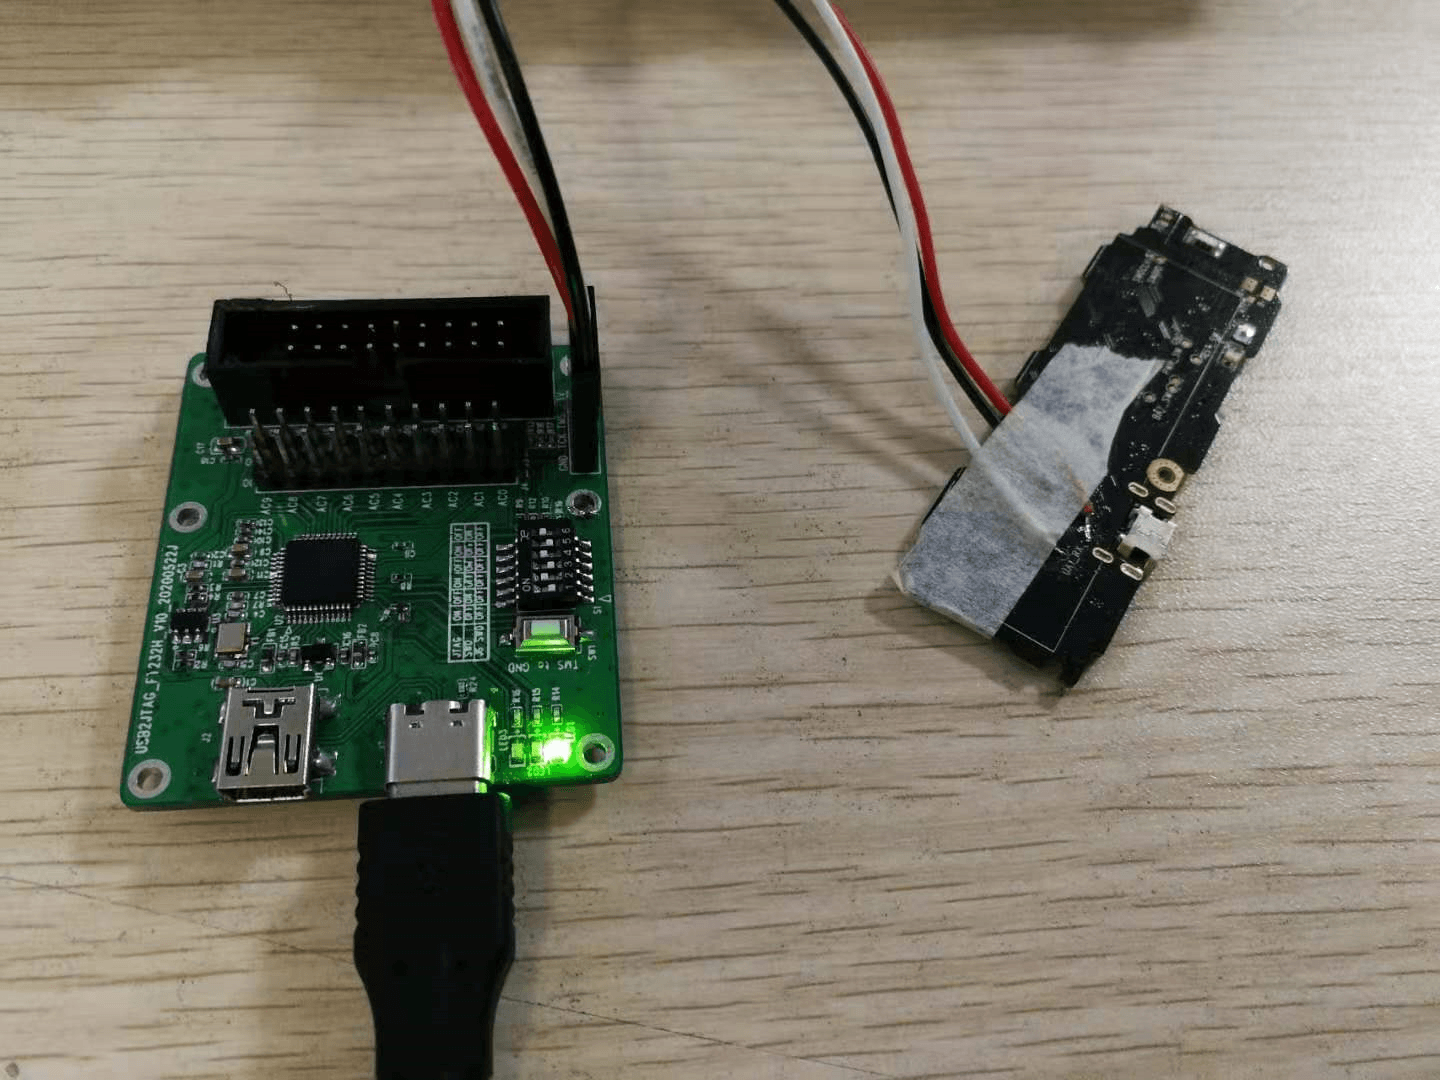
3.1 硬件连接
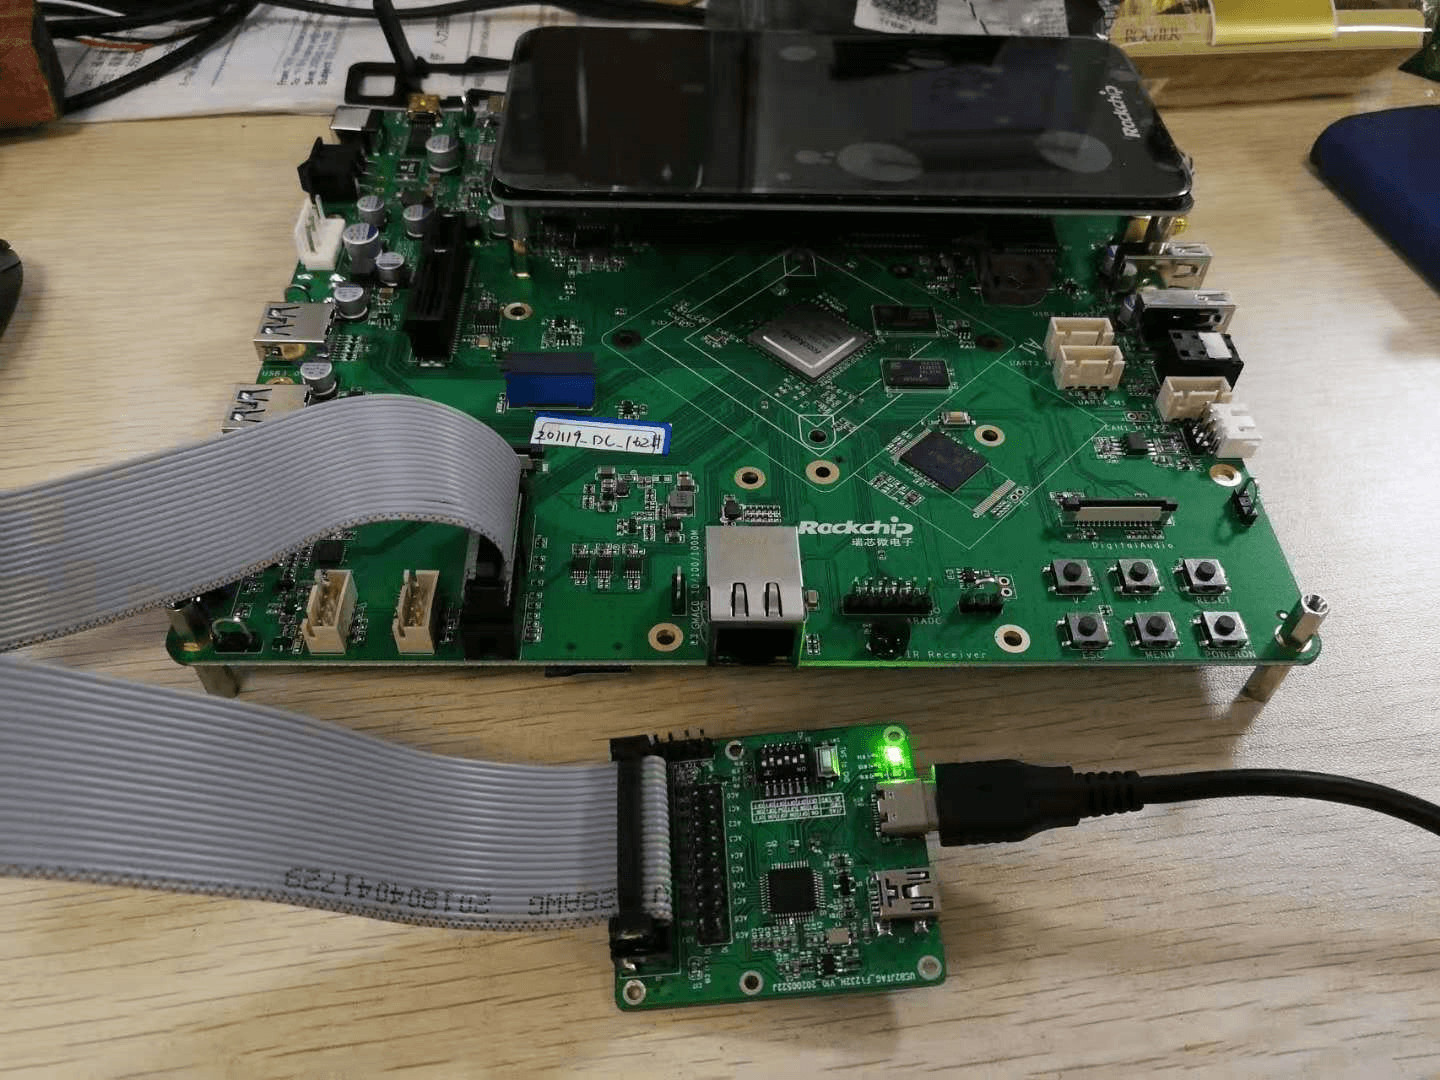
3.1.1 ARM 20PIN 标准 JTAG 接口
3.1.2 TF 转 JTAG 小板
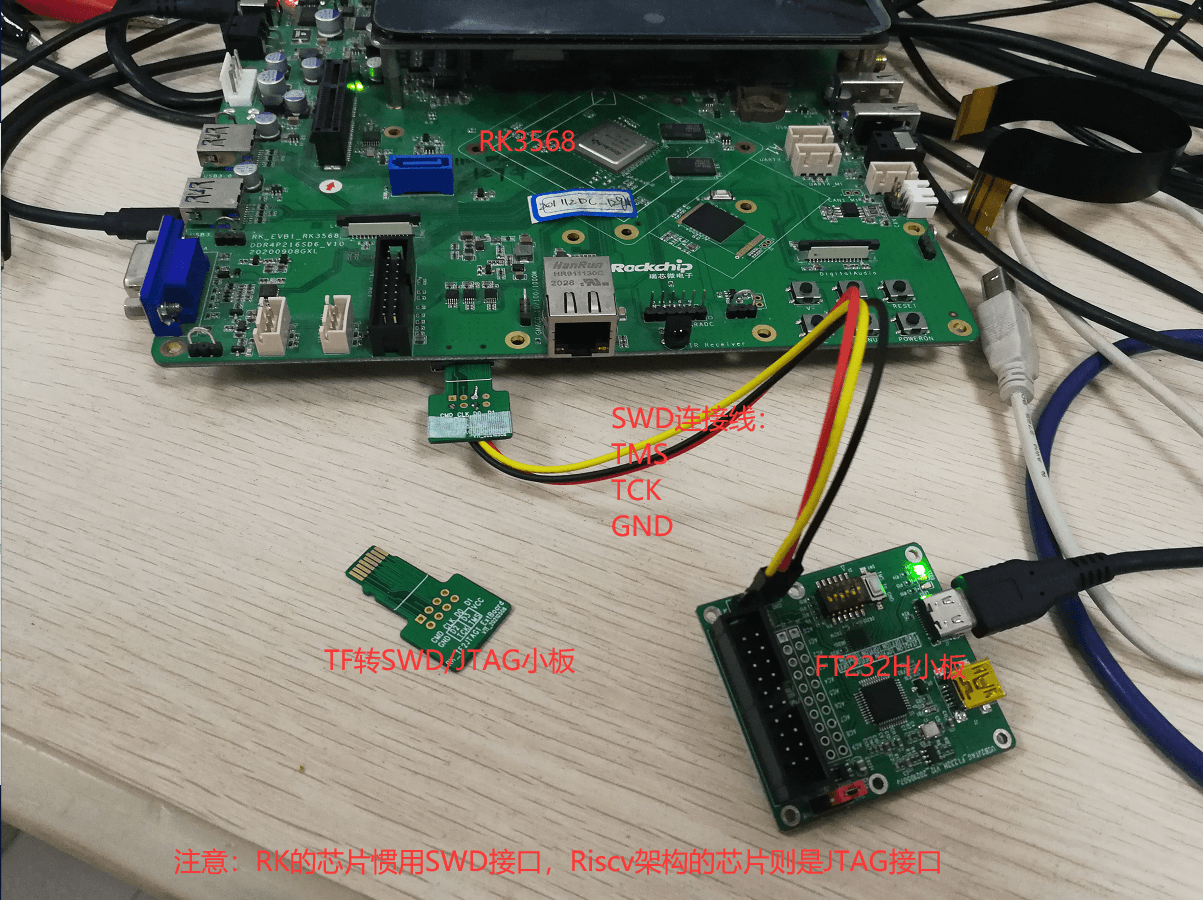
原图接线标注为 TMS、TCK、GND,并注明 RK 架构芯片采用 SWD 接口、RISC-V 架构芯片采用 JTAG 接口;这是原图所示工具/芯片配置的说明,不能替代目标板原理图核对。
3.1.3 UART2 与 JTAG 复用
3.2 软件连接
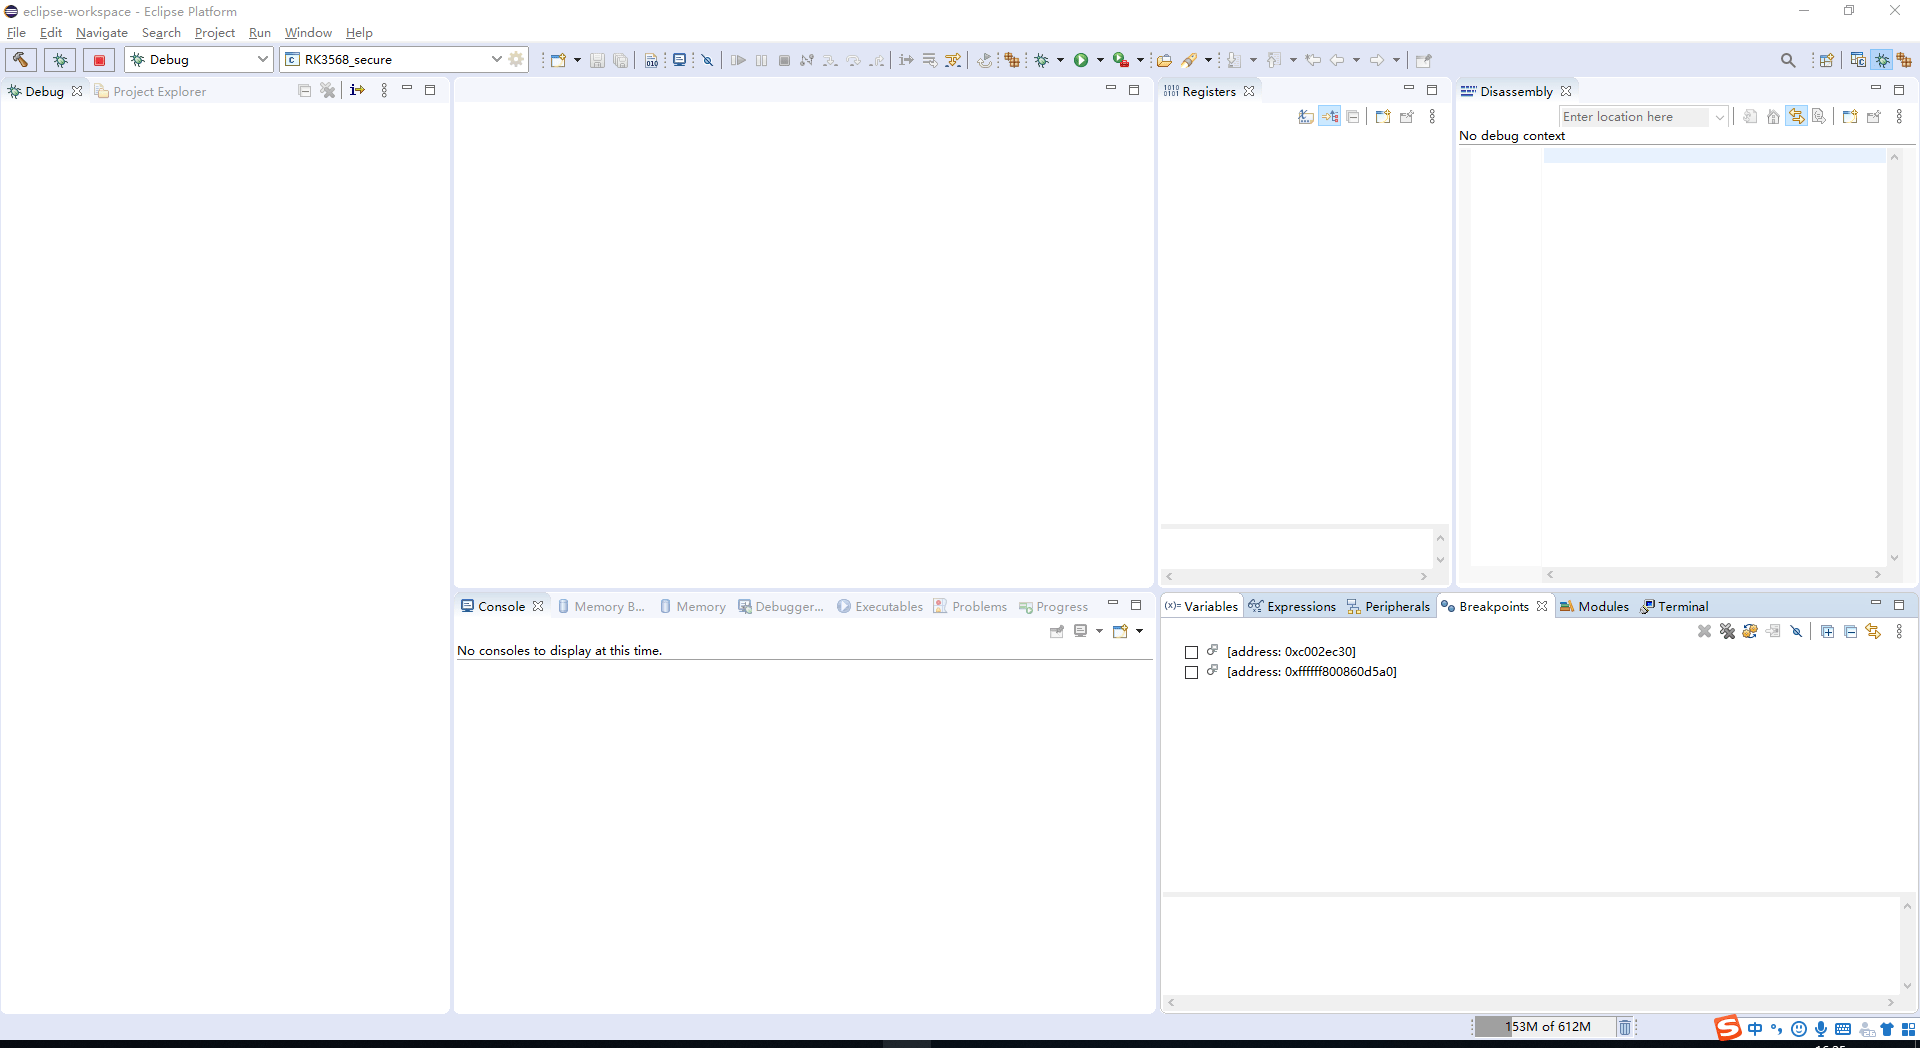
3.2.1 运行启动程序
运行 Eclipse_for_OpenOCD V1.0.exe。
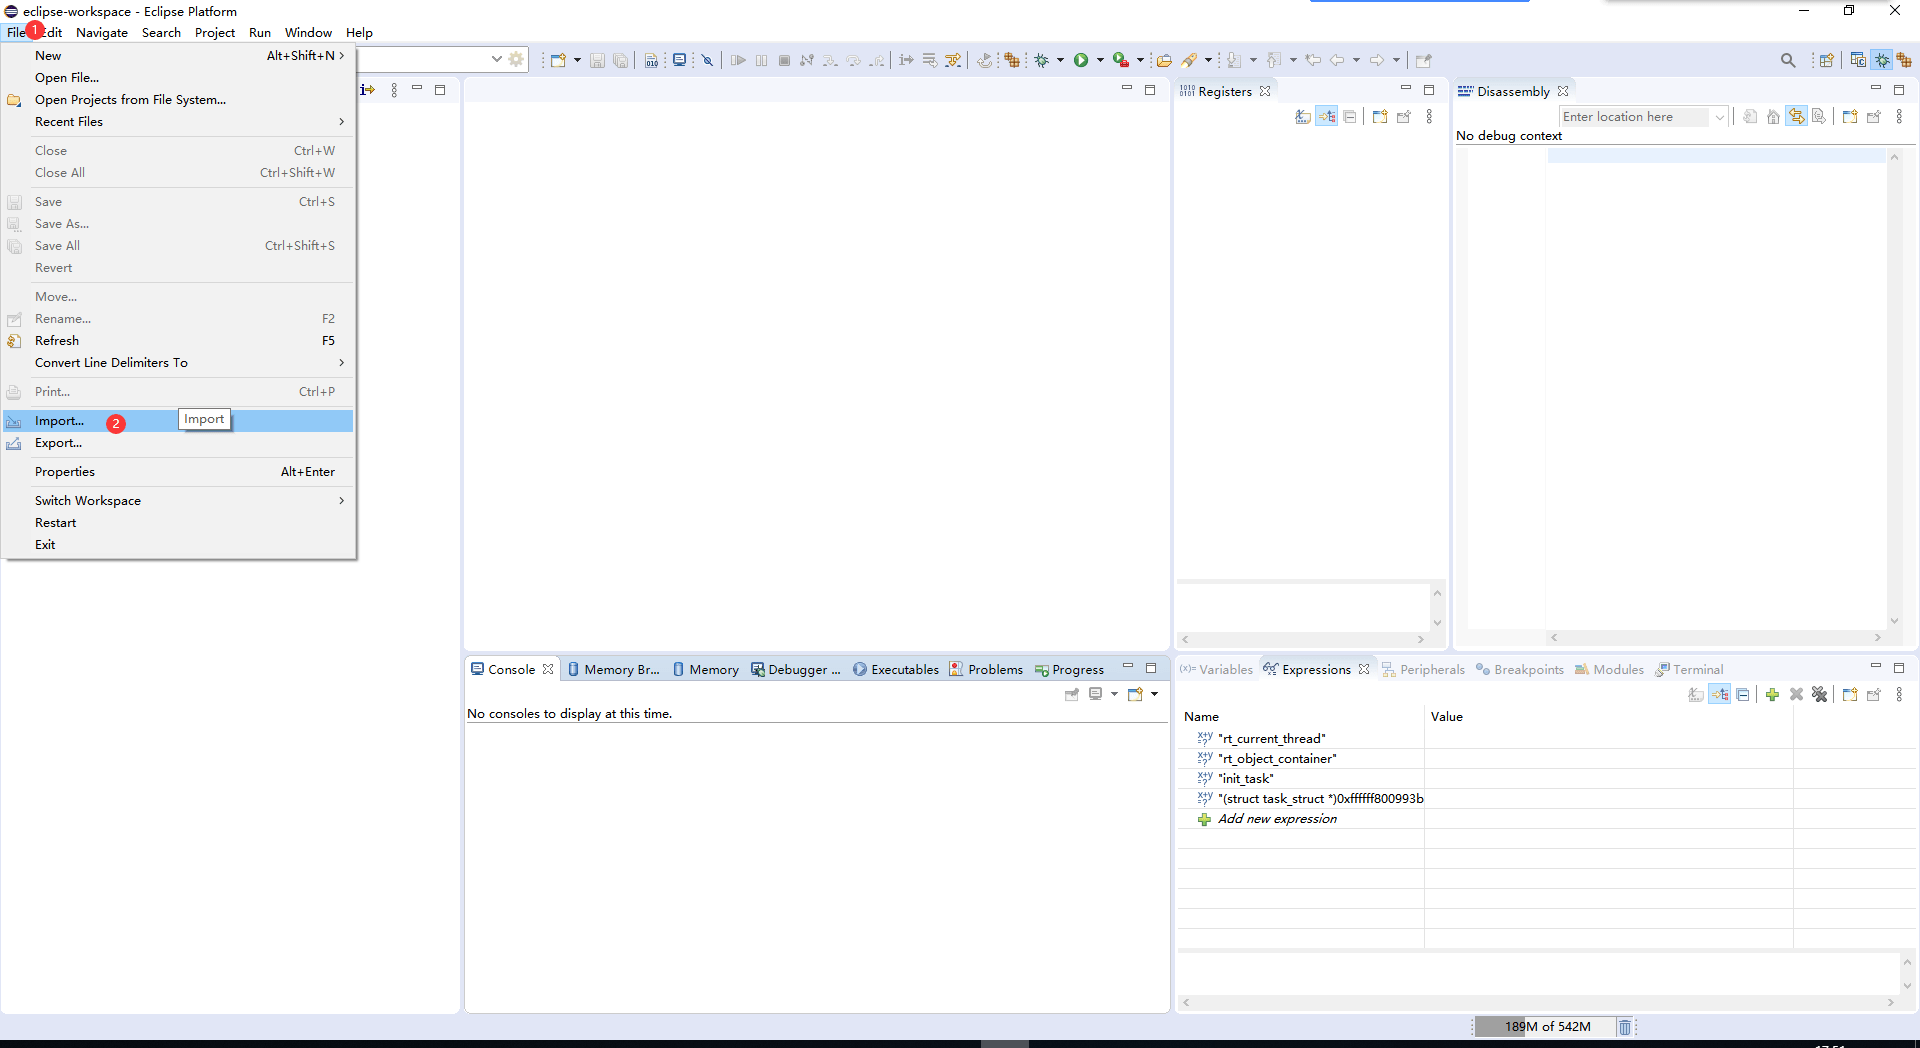
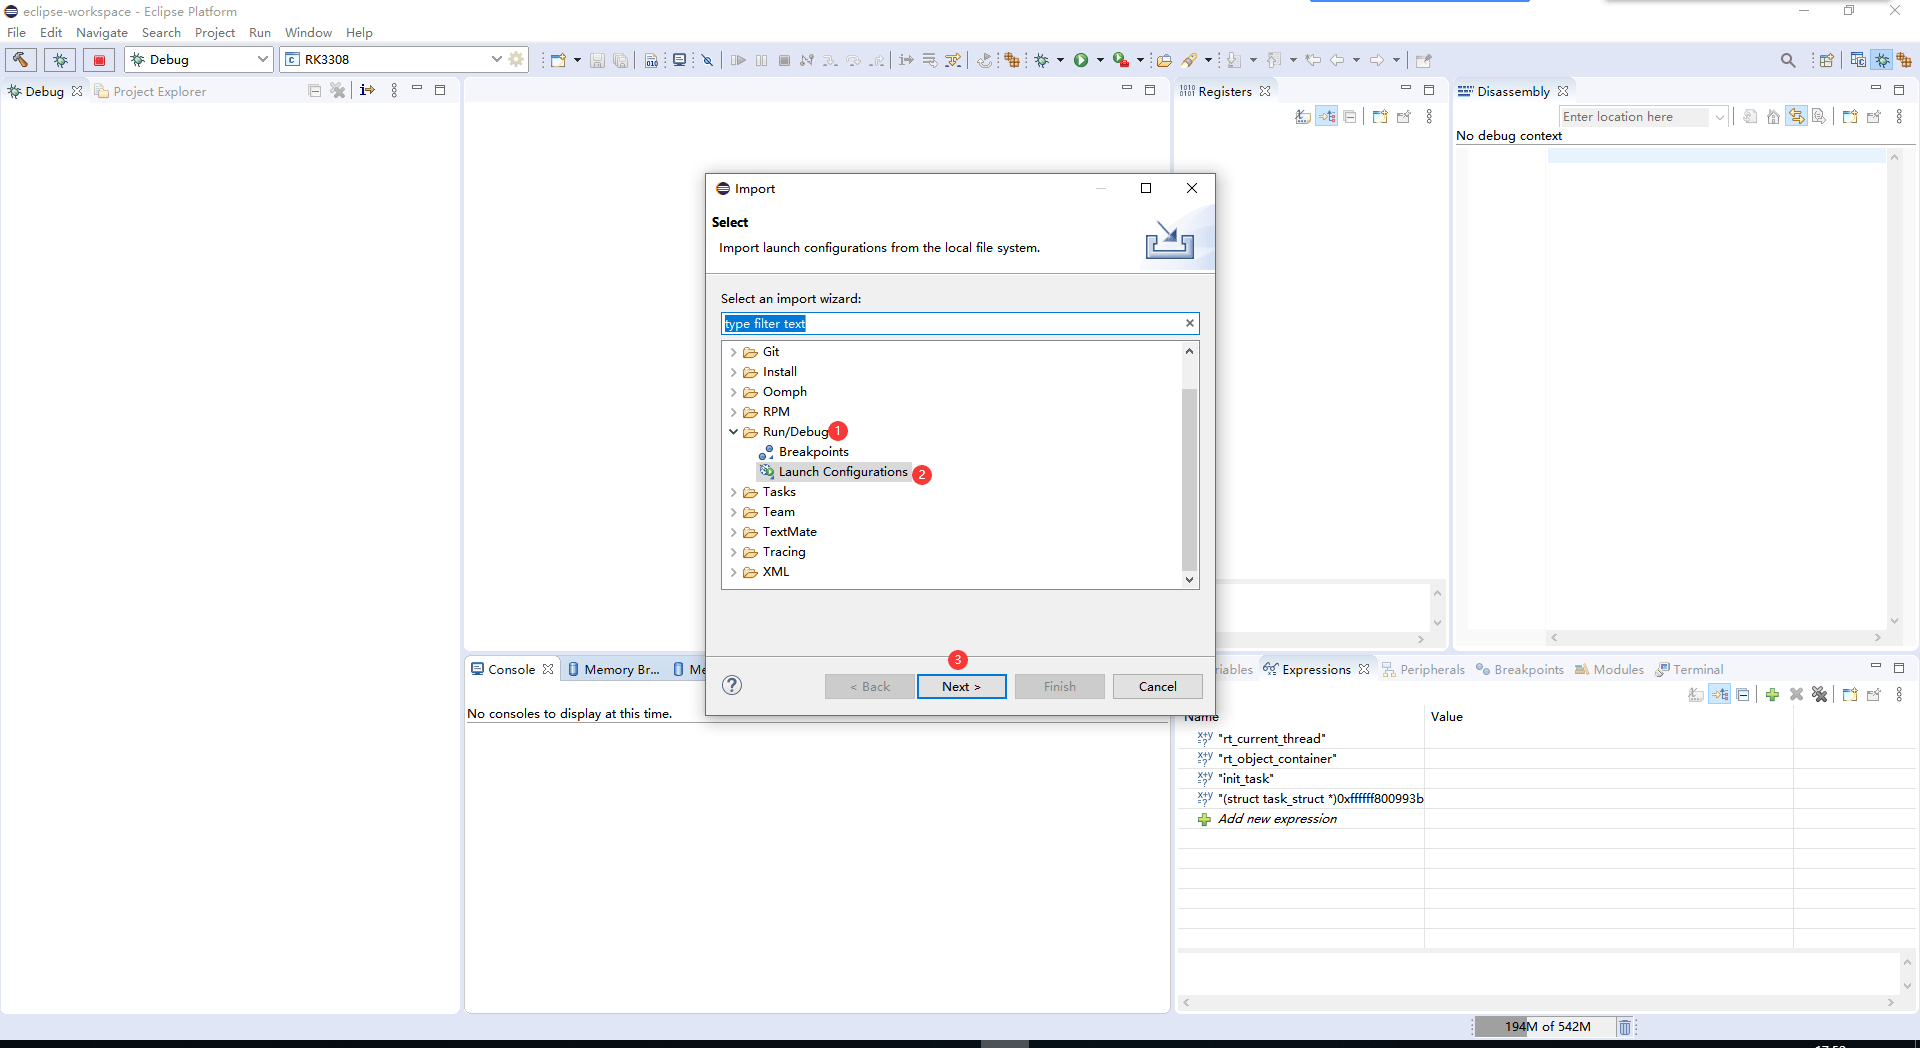
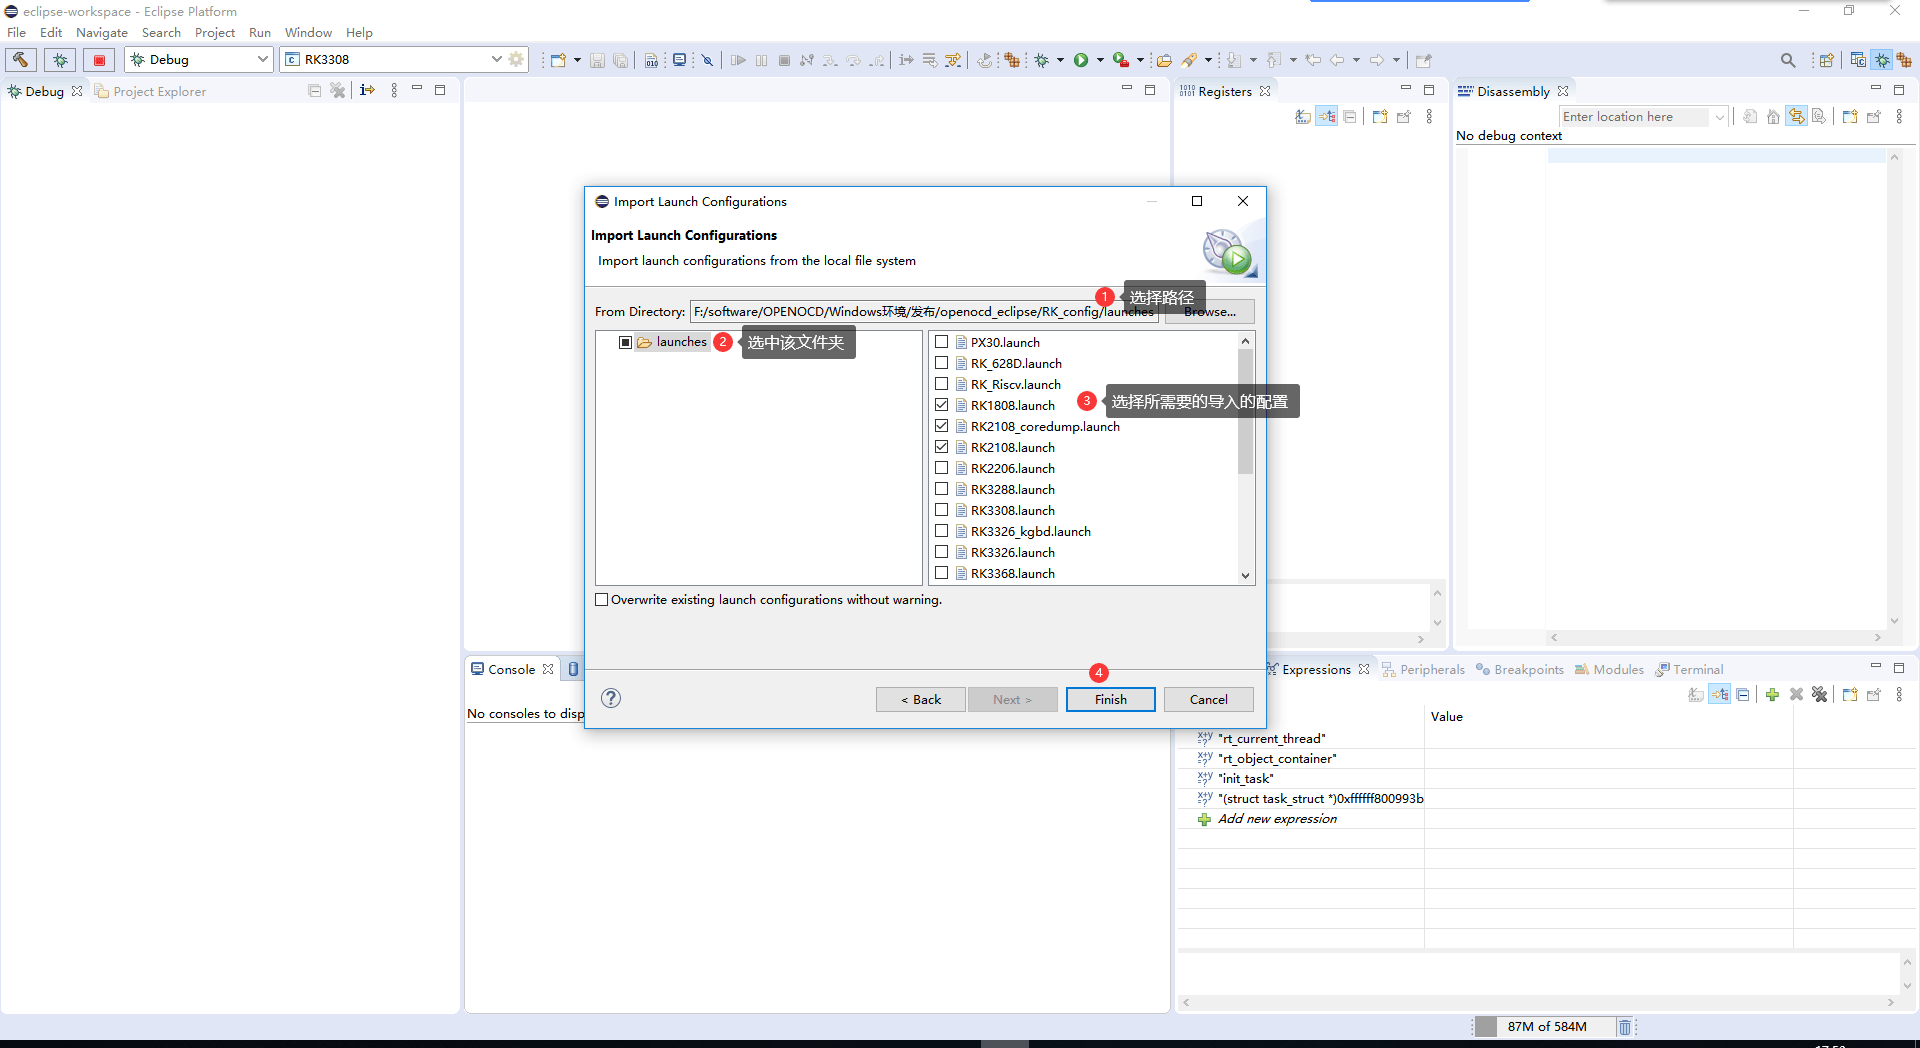
3.2.2 导入芯片配置(可选)
常规软件包已包含芯片配置;若更新、修改或增加配置,则按图导入。
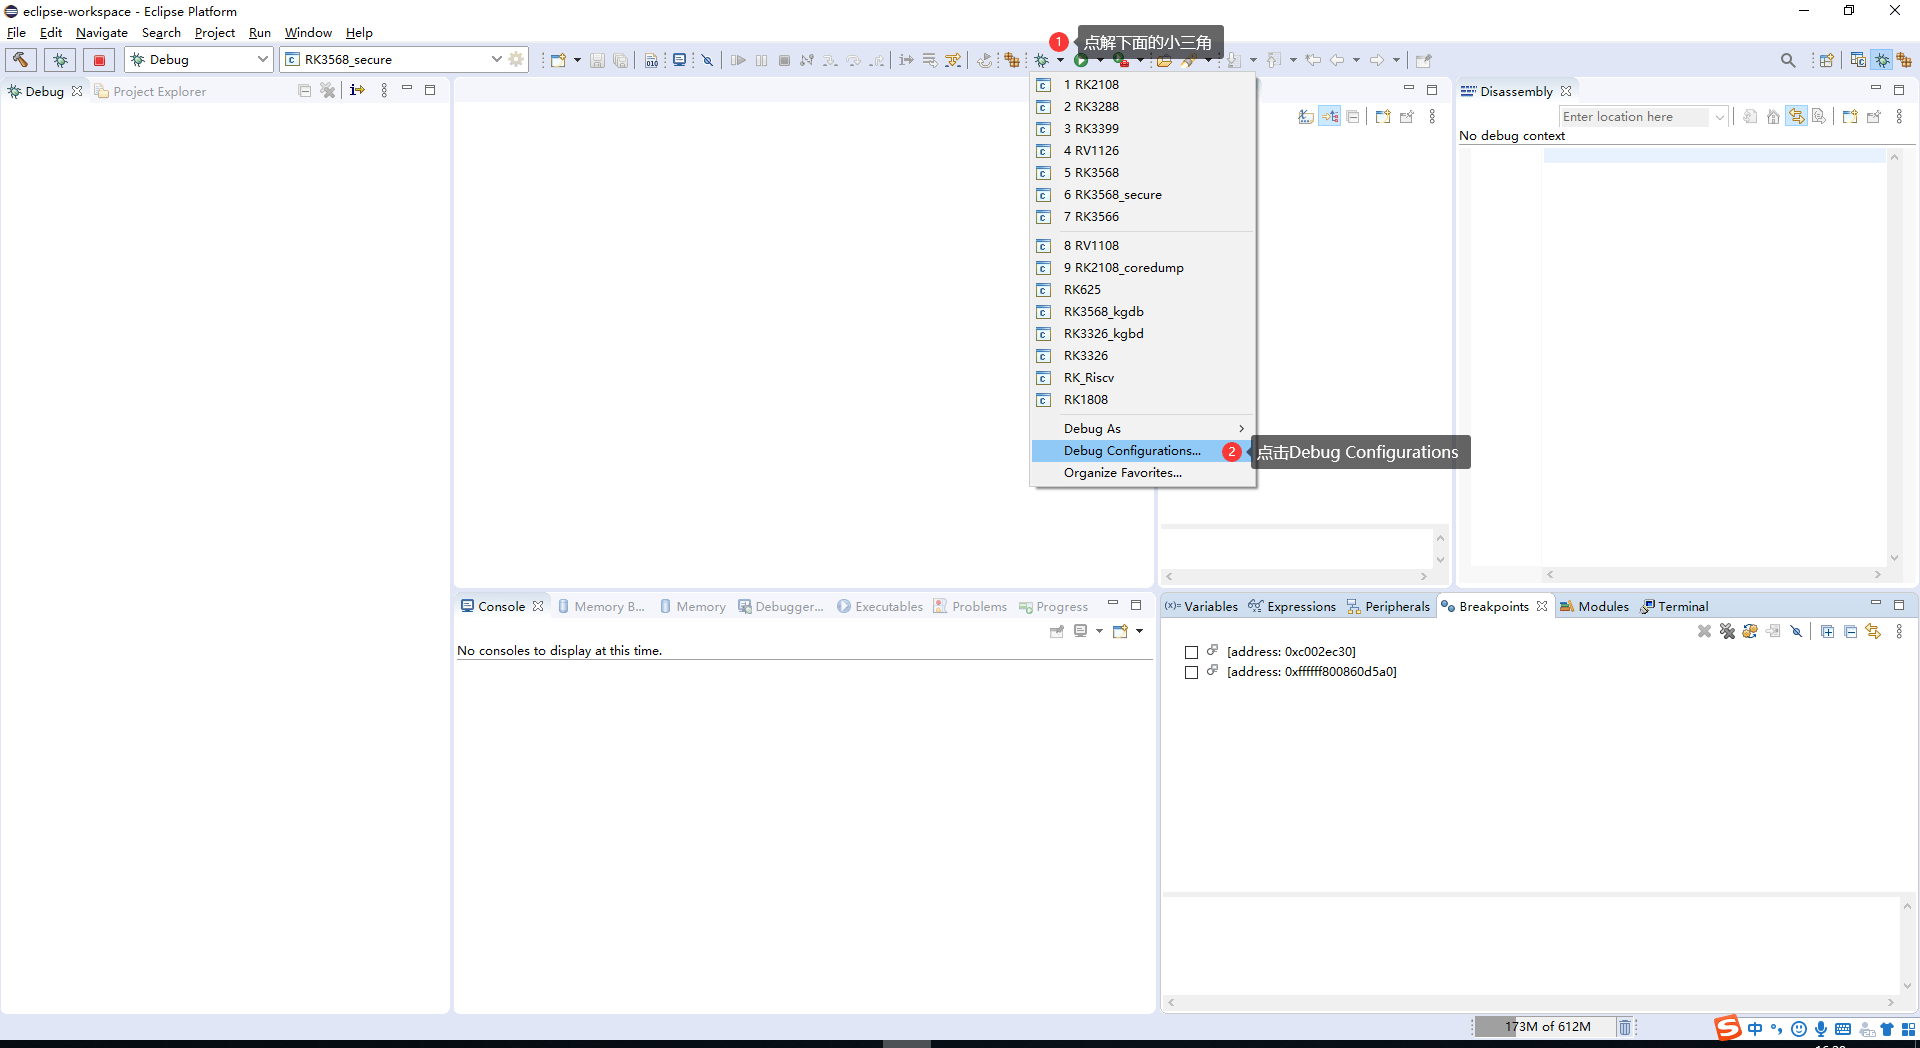
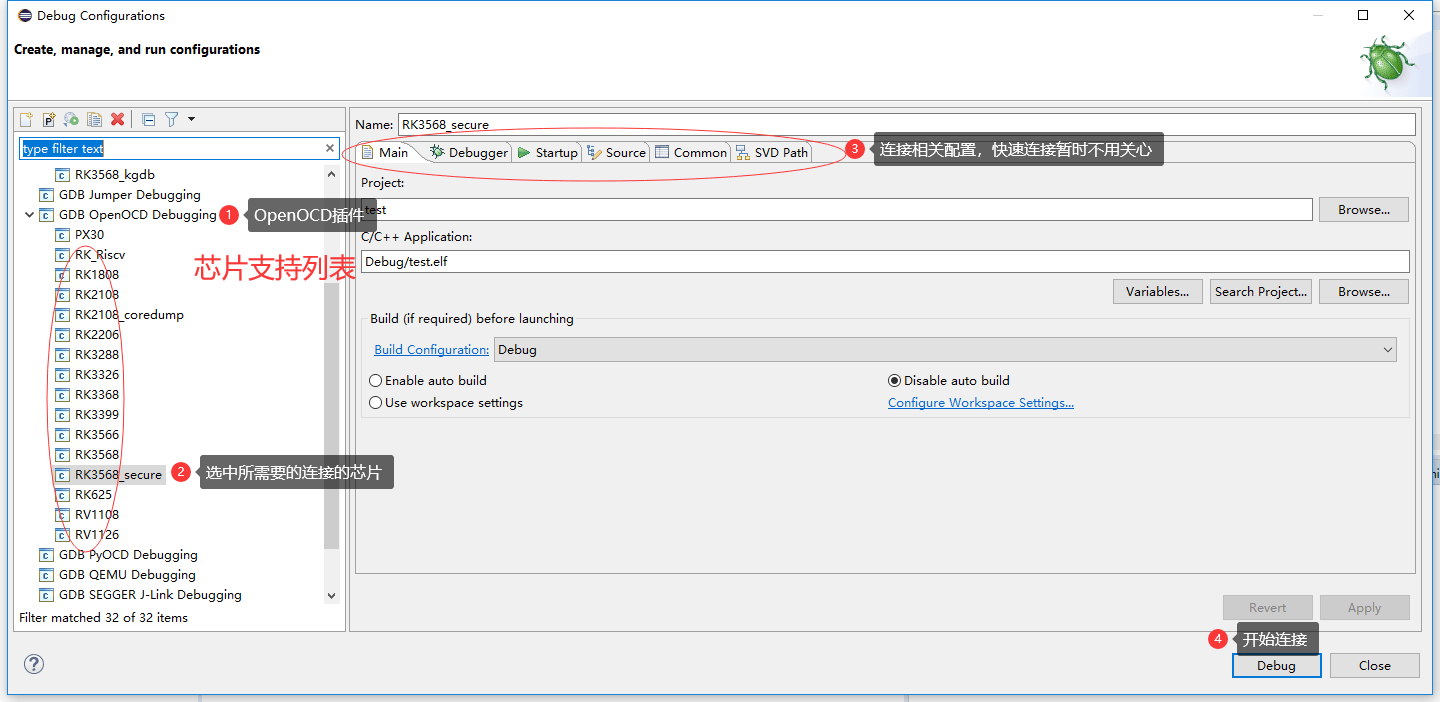
3.2.3 在支持列表中选择目标芯片
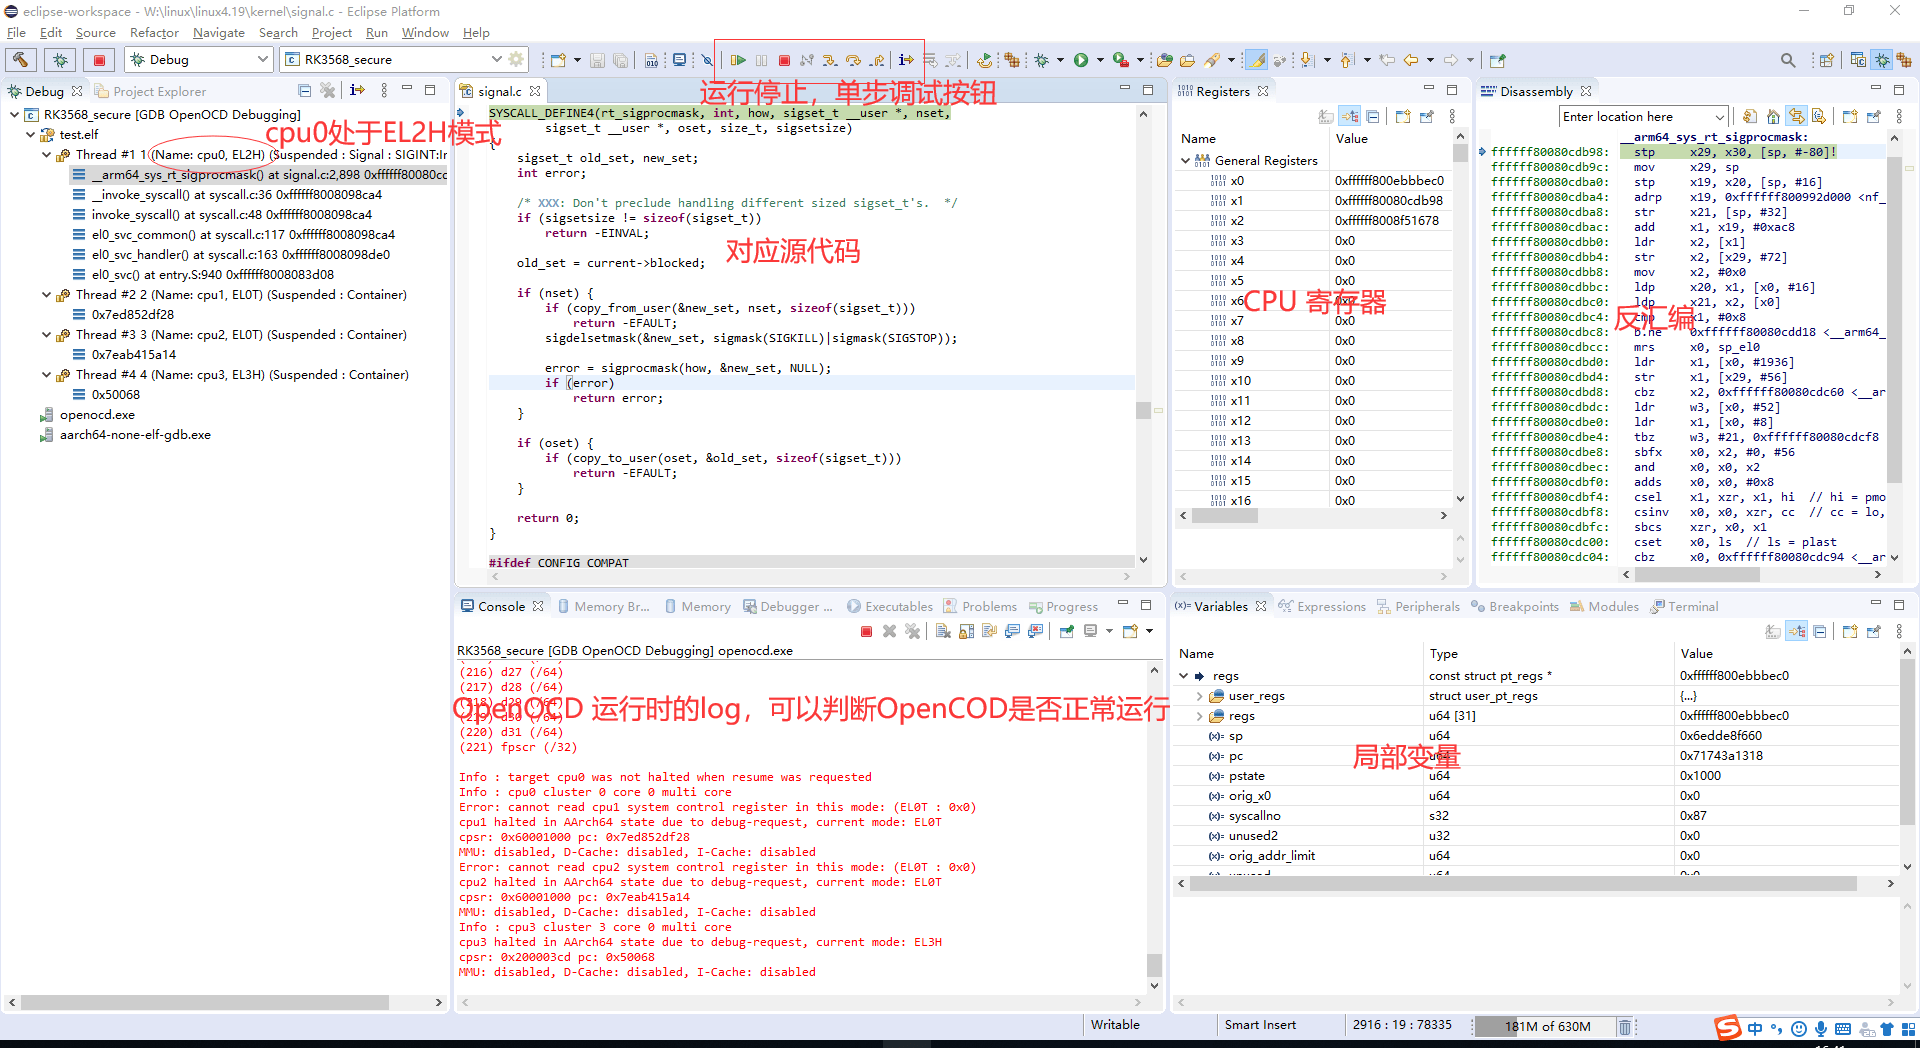
3.2.4 连接成功
连接成功并停止 CPU 后的界面如下。
3.2.5 连接失败
3.2.5.1 无法识别 JTAG 适配器
确认适配器驱动和硬件正常,参考 Rockchip_Developer_Guide_FT232H_USB2JTAG.pdf。原文 OpenOCD 默认自动识别 FT232H、FT2232H、J-Link 三种适配器。
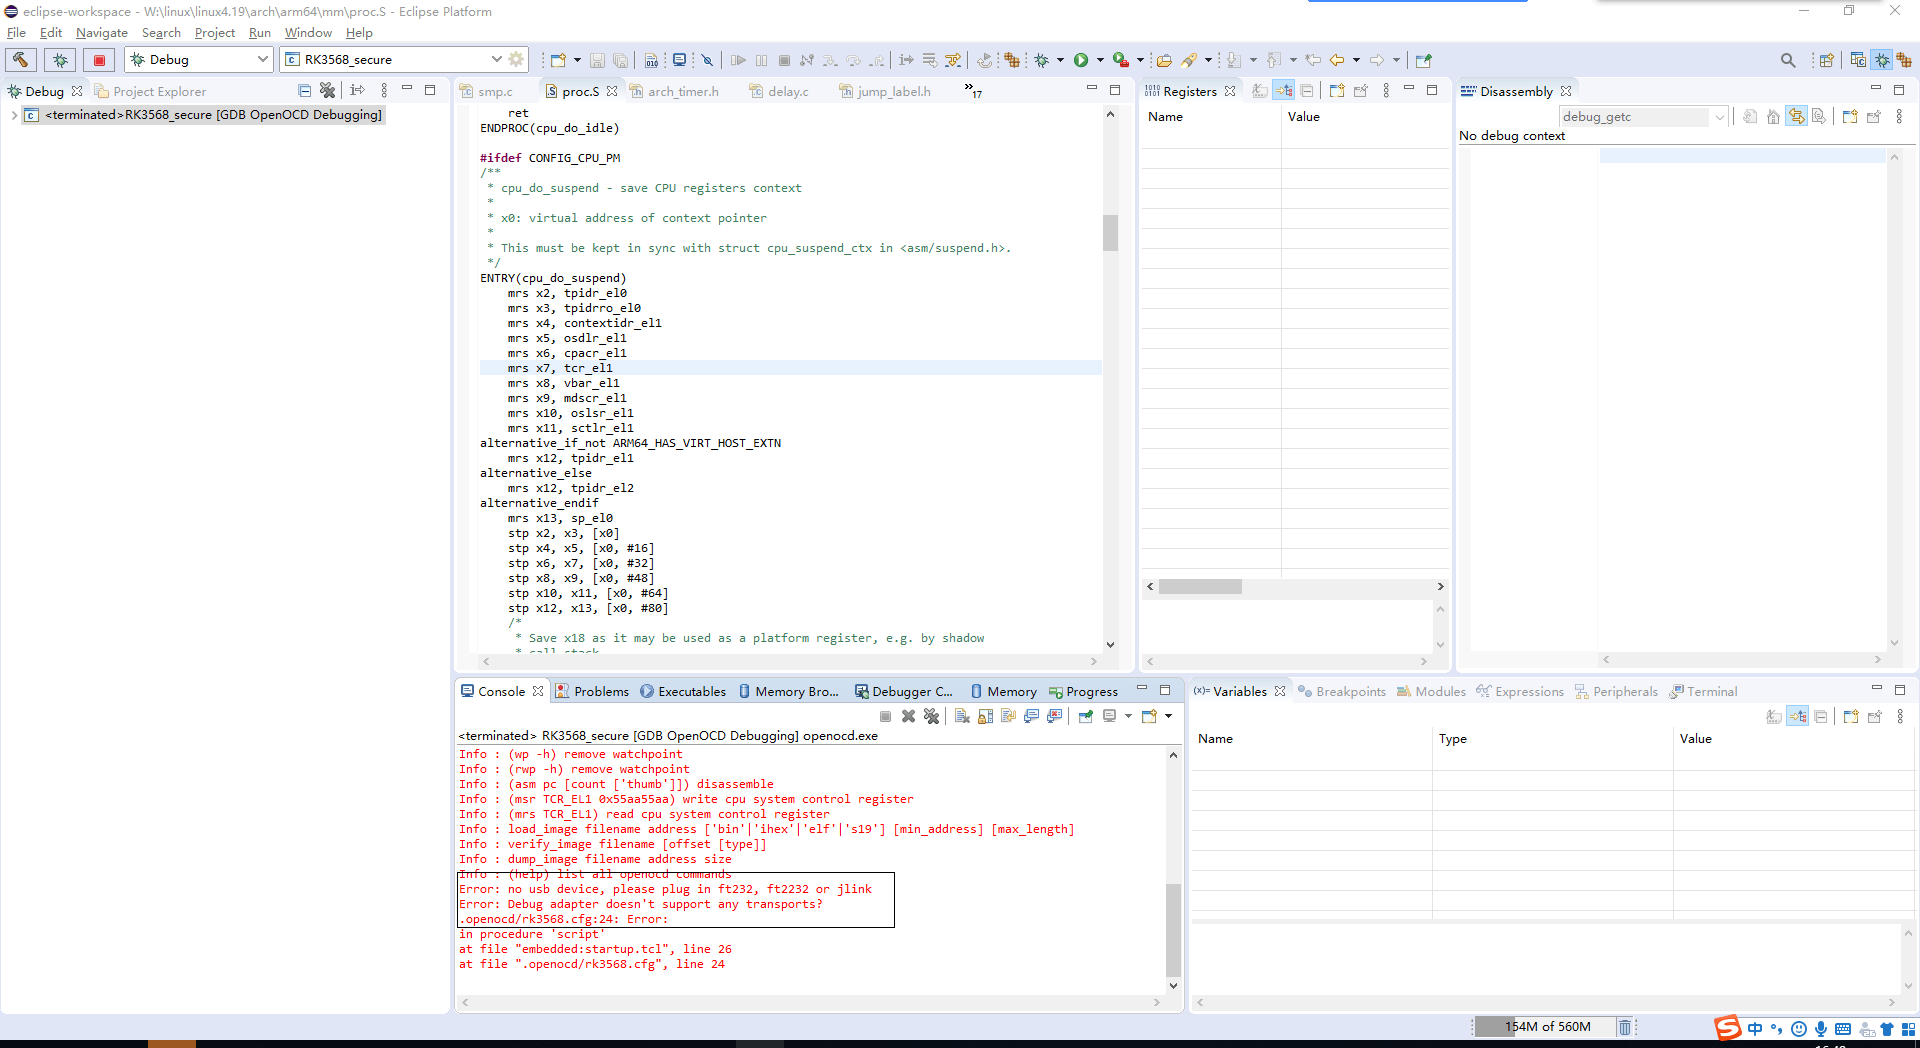
3.2.5.2 无法识别芯片
检查引脚接触、JTAG IOMUX 是否使能,必要时降低 TCK。以下信息表示硬件连接和 JTAG 识别正常,但芯片状态异常,无法继续调试。
the connection is ok, but the cpu is in incorrect state
以下两条信息提示硬件连接、IOMUX 或引脚接触问题:
please check hardware, make sure swd/jtag iomux is correct, and the pins connection is ok
please check hardware, the swdio(tms) pin is low level
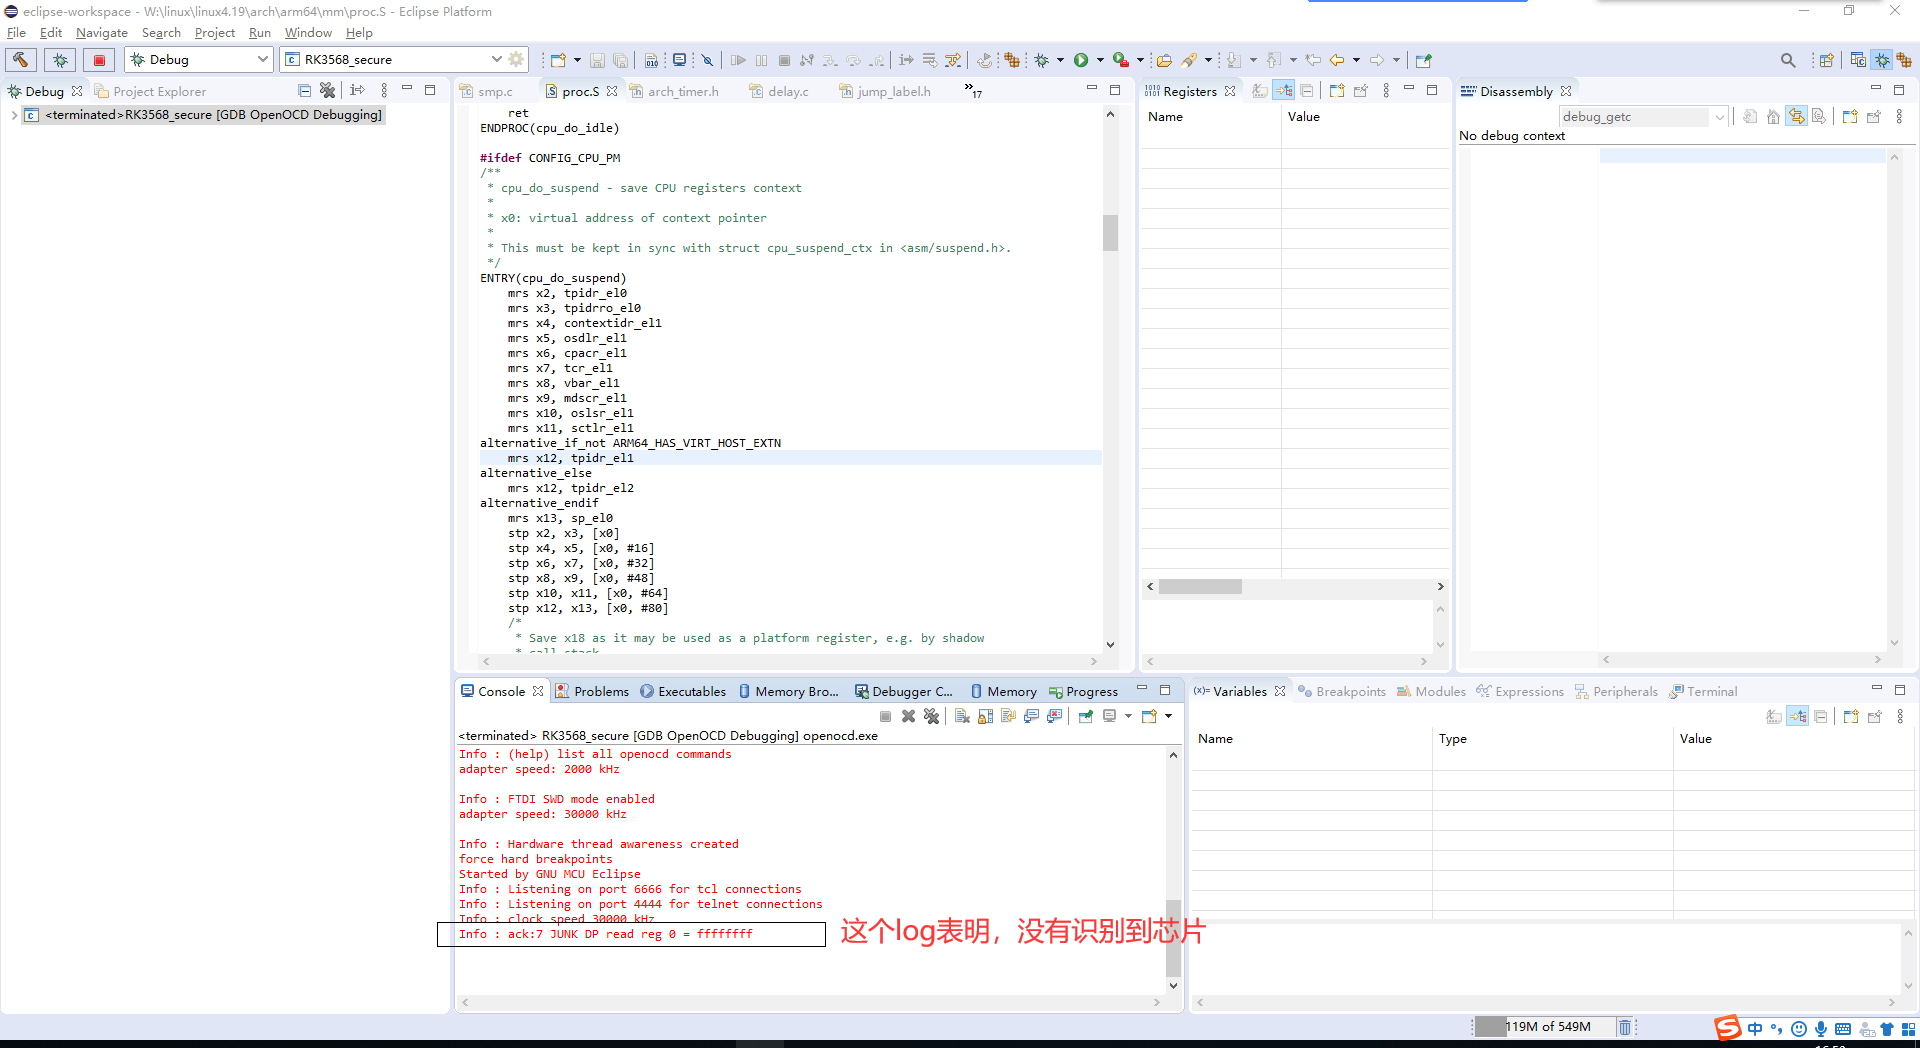
出现以下日志时,降低 JTAG 速率后重试。
Please, adapter speed 1000 set clk 1MHz to try again
4. 基础调试功能
4.1 调整 SWD/JTAG 速率
若硬件限制导致通信失败,可降低 TCK,例如 1000 KHz。原文最大值为 30000 KHz,建议 15000 KHz 或 7500 KHz;实际值仍取决于板级连接和适配器。
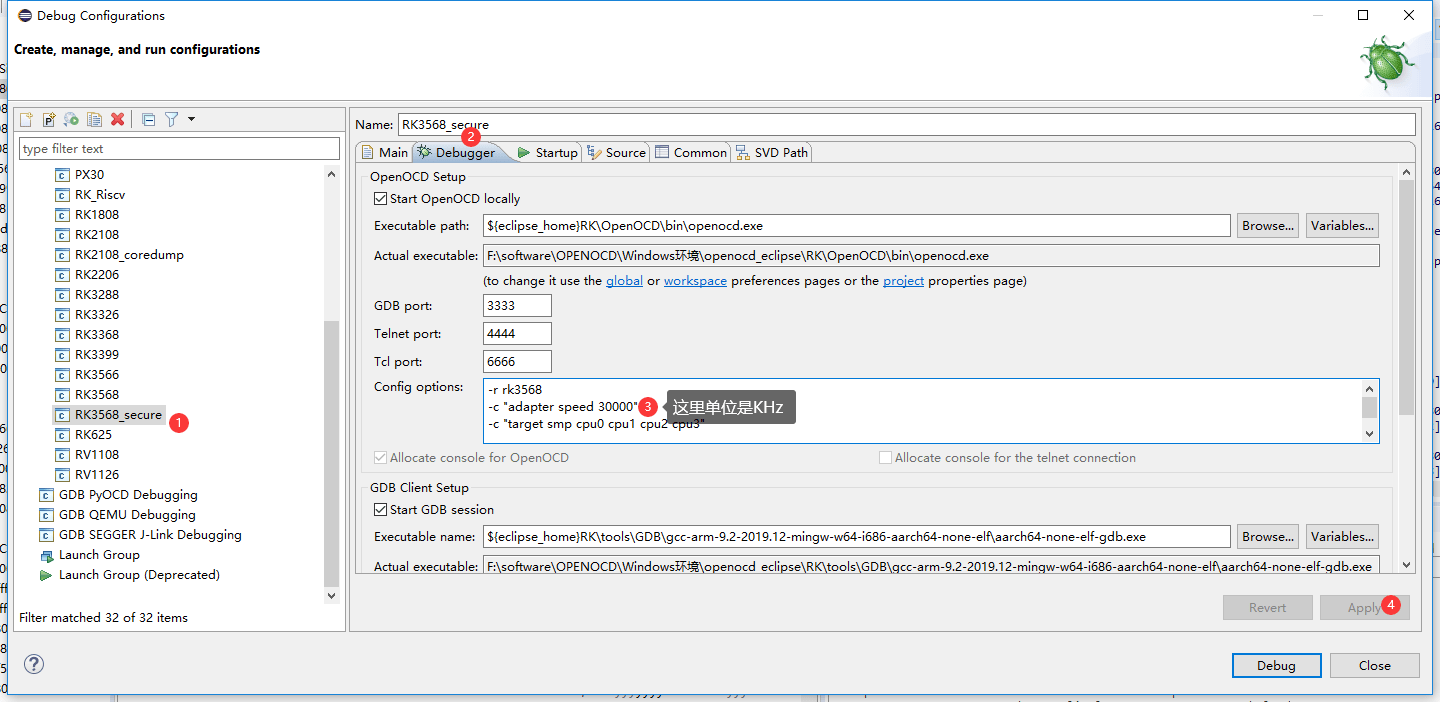
4.2 静态加载符号表
在连接前设置,只能静态加载一个符号表。
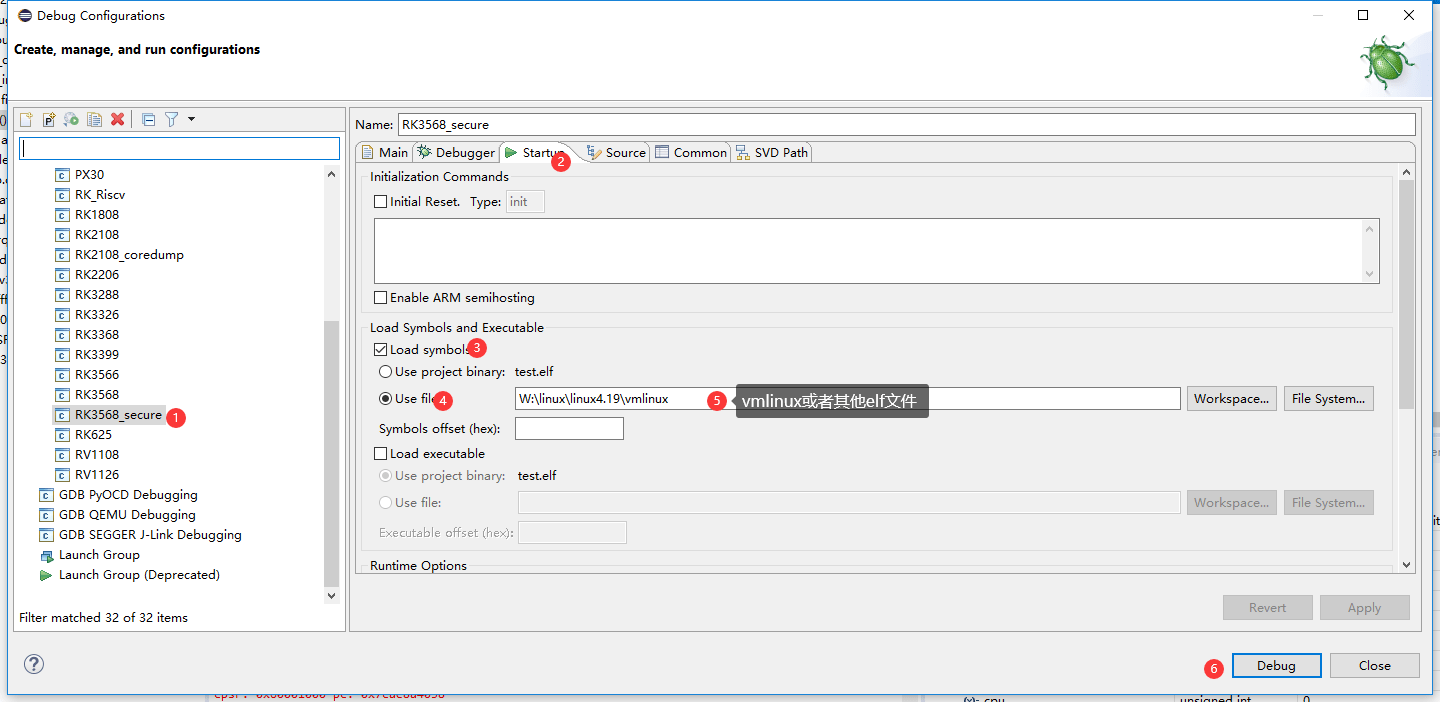
4.3 动态加载符号表
Debugger Console 是 GDB 命令窗口,可用 add-symbol-file 同时加载多个符号表。下列分别加载 Linux、BL31、TPL、SPL、U-Boot。Windows 路径中的反斜杠应改为正斜杠;加载后单步执行一次,函数调用栈才显示。
 加载linux符号表:add-symbol-file G:/vmlinux
 加载bl31符号表:add-symbol-file T:/work/uboot/u-boot/bl31.elf

 加载tpl符号表:add-symbol-file T:/work/uboot/u-boot/tpl/u-boot-tpl
 加载spl符号表:add-symbol-file T:/work/uboot/u-boot/spl/u-boot-spl
 加载uboot符号表:add-symbol-file T:/work/uboot/u-boot/u-boot
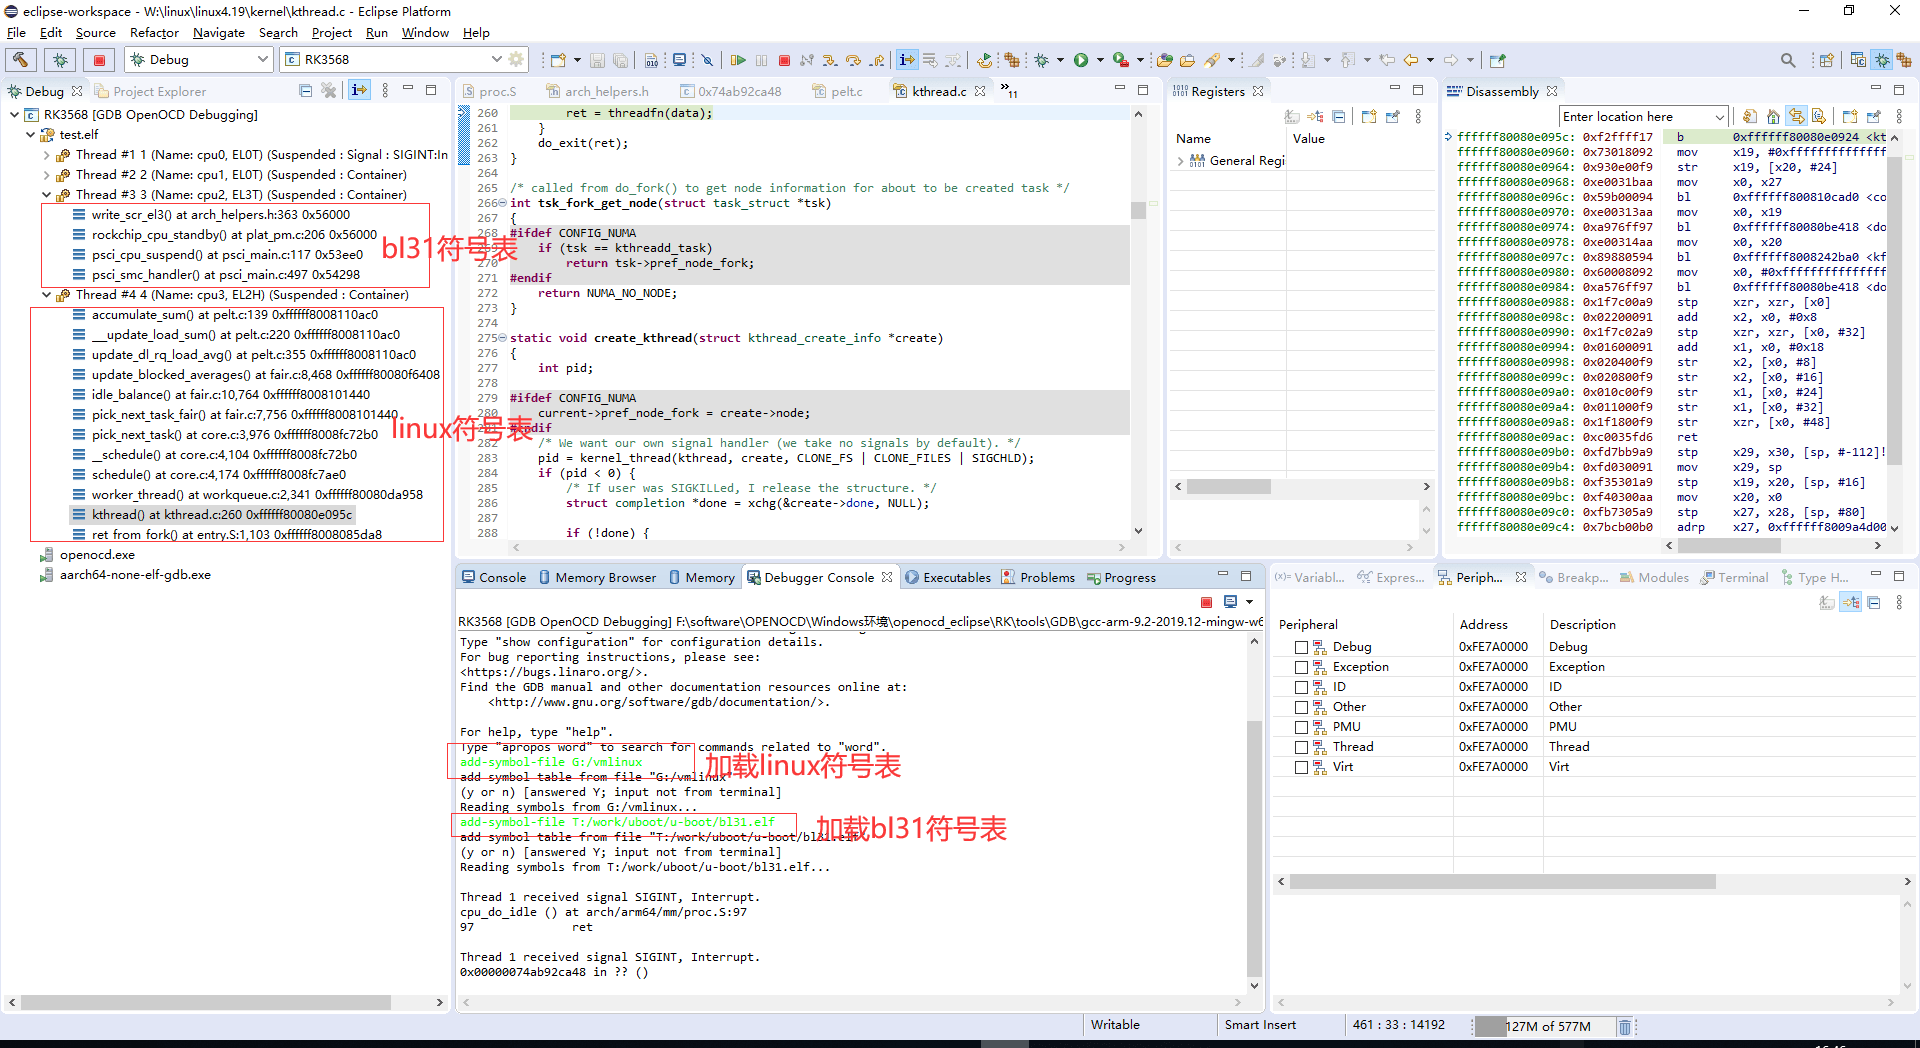
4.4 设置源代码路径
方法一通过源代码查找界面设置;方法二进入 Debug Configurations 设置,见两张原图。
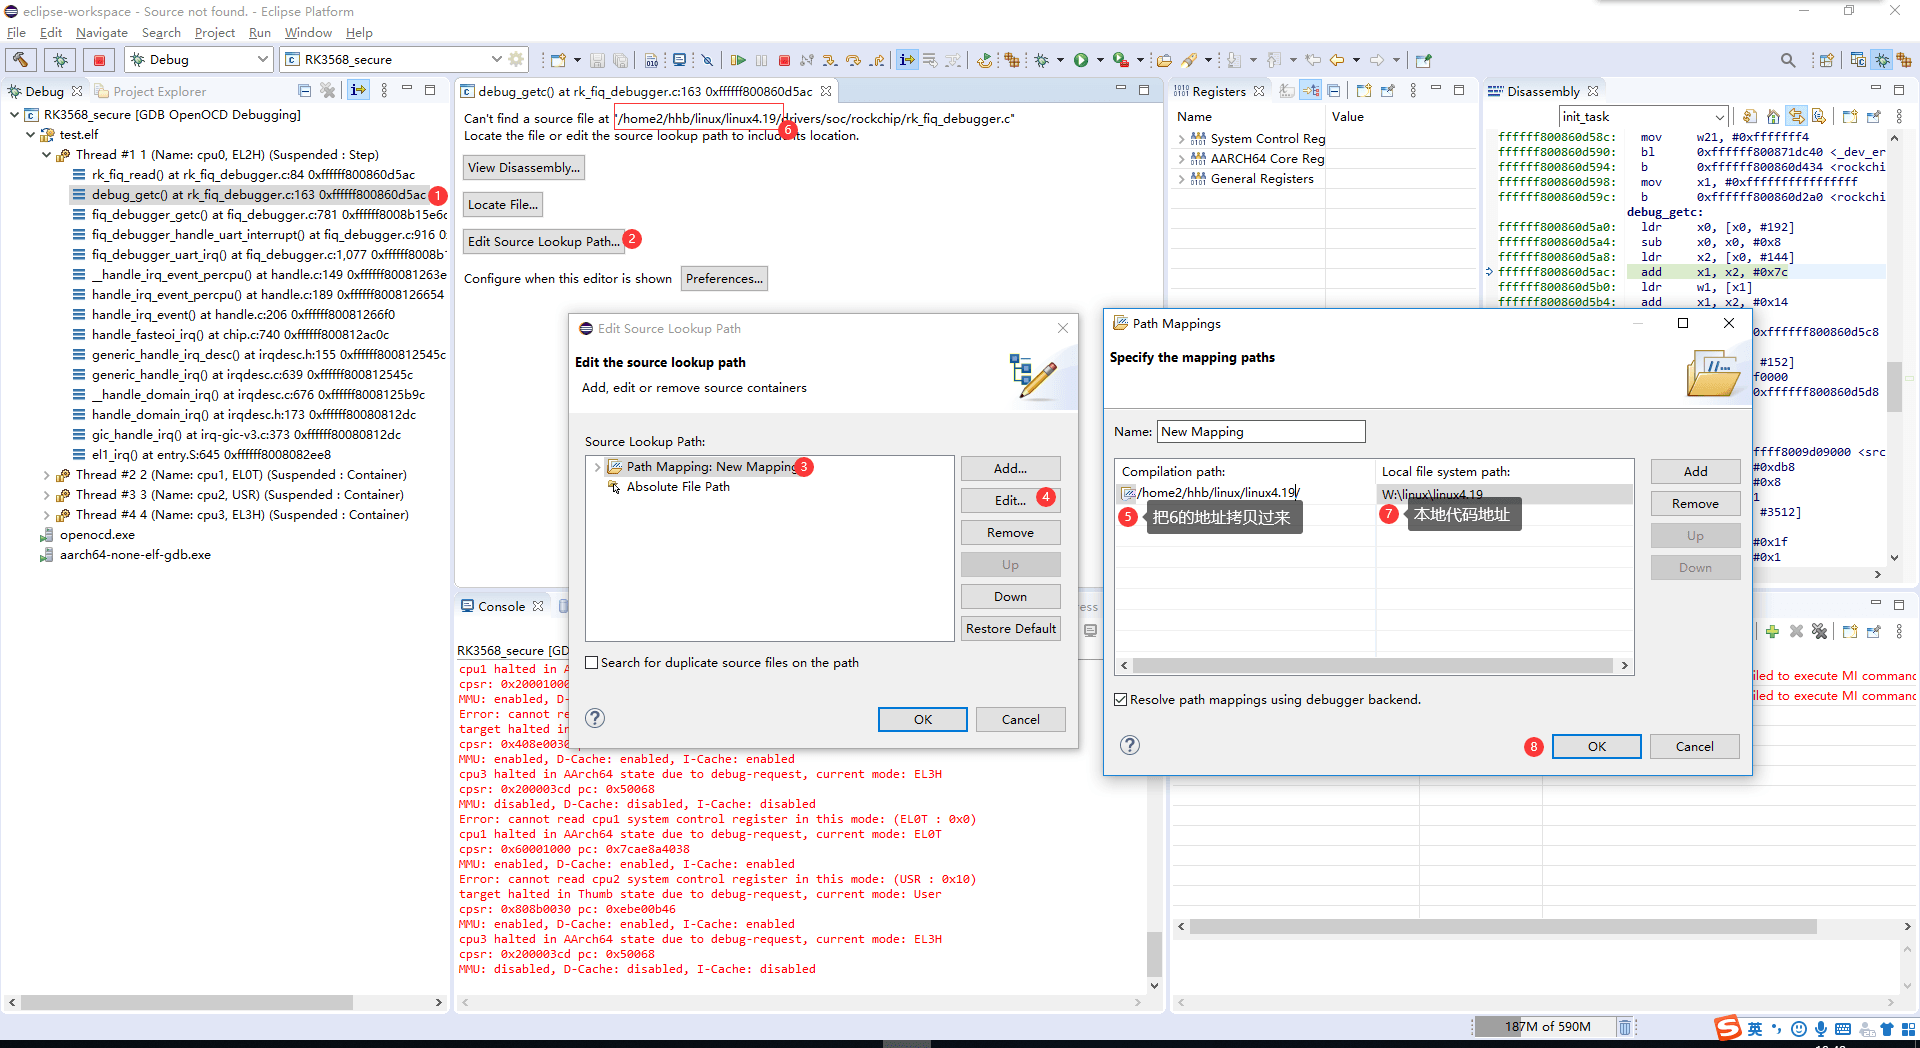
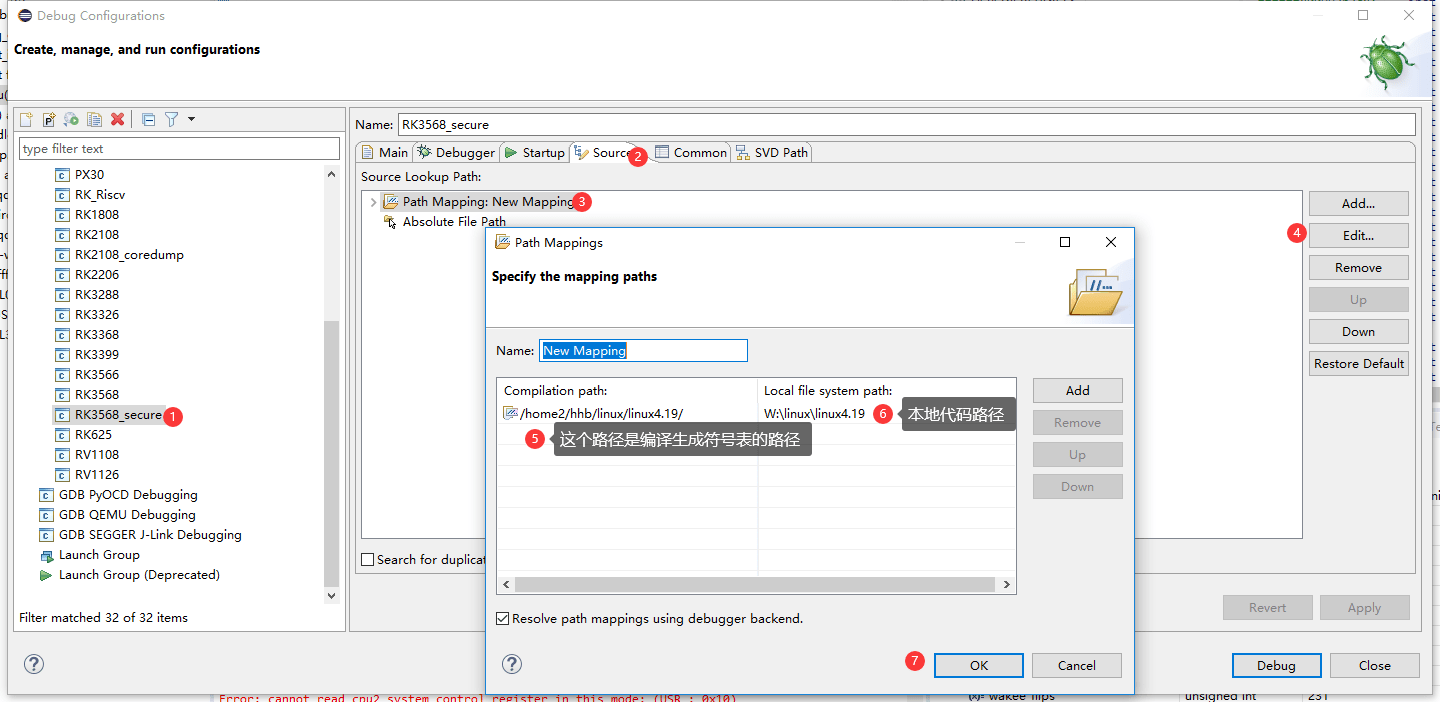
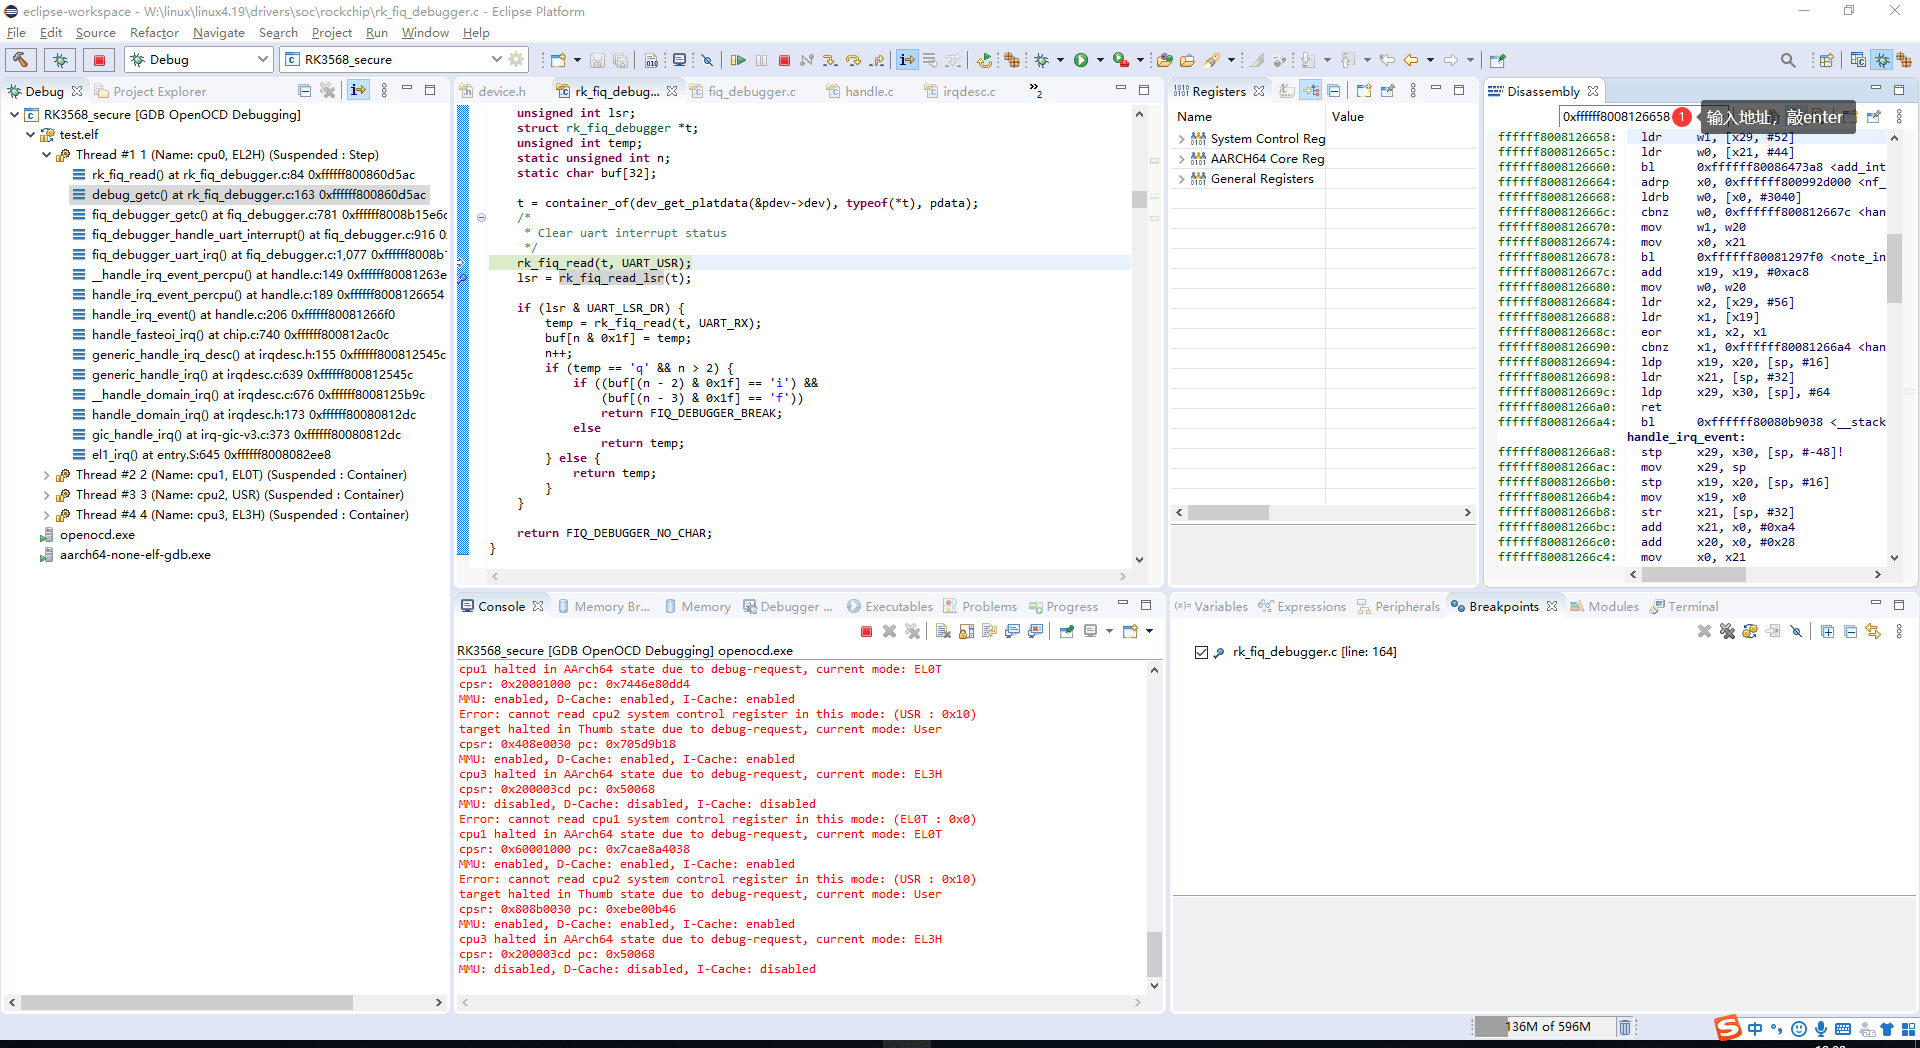
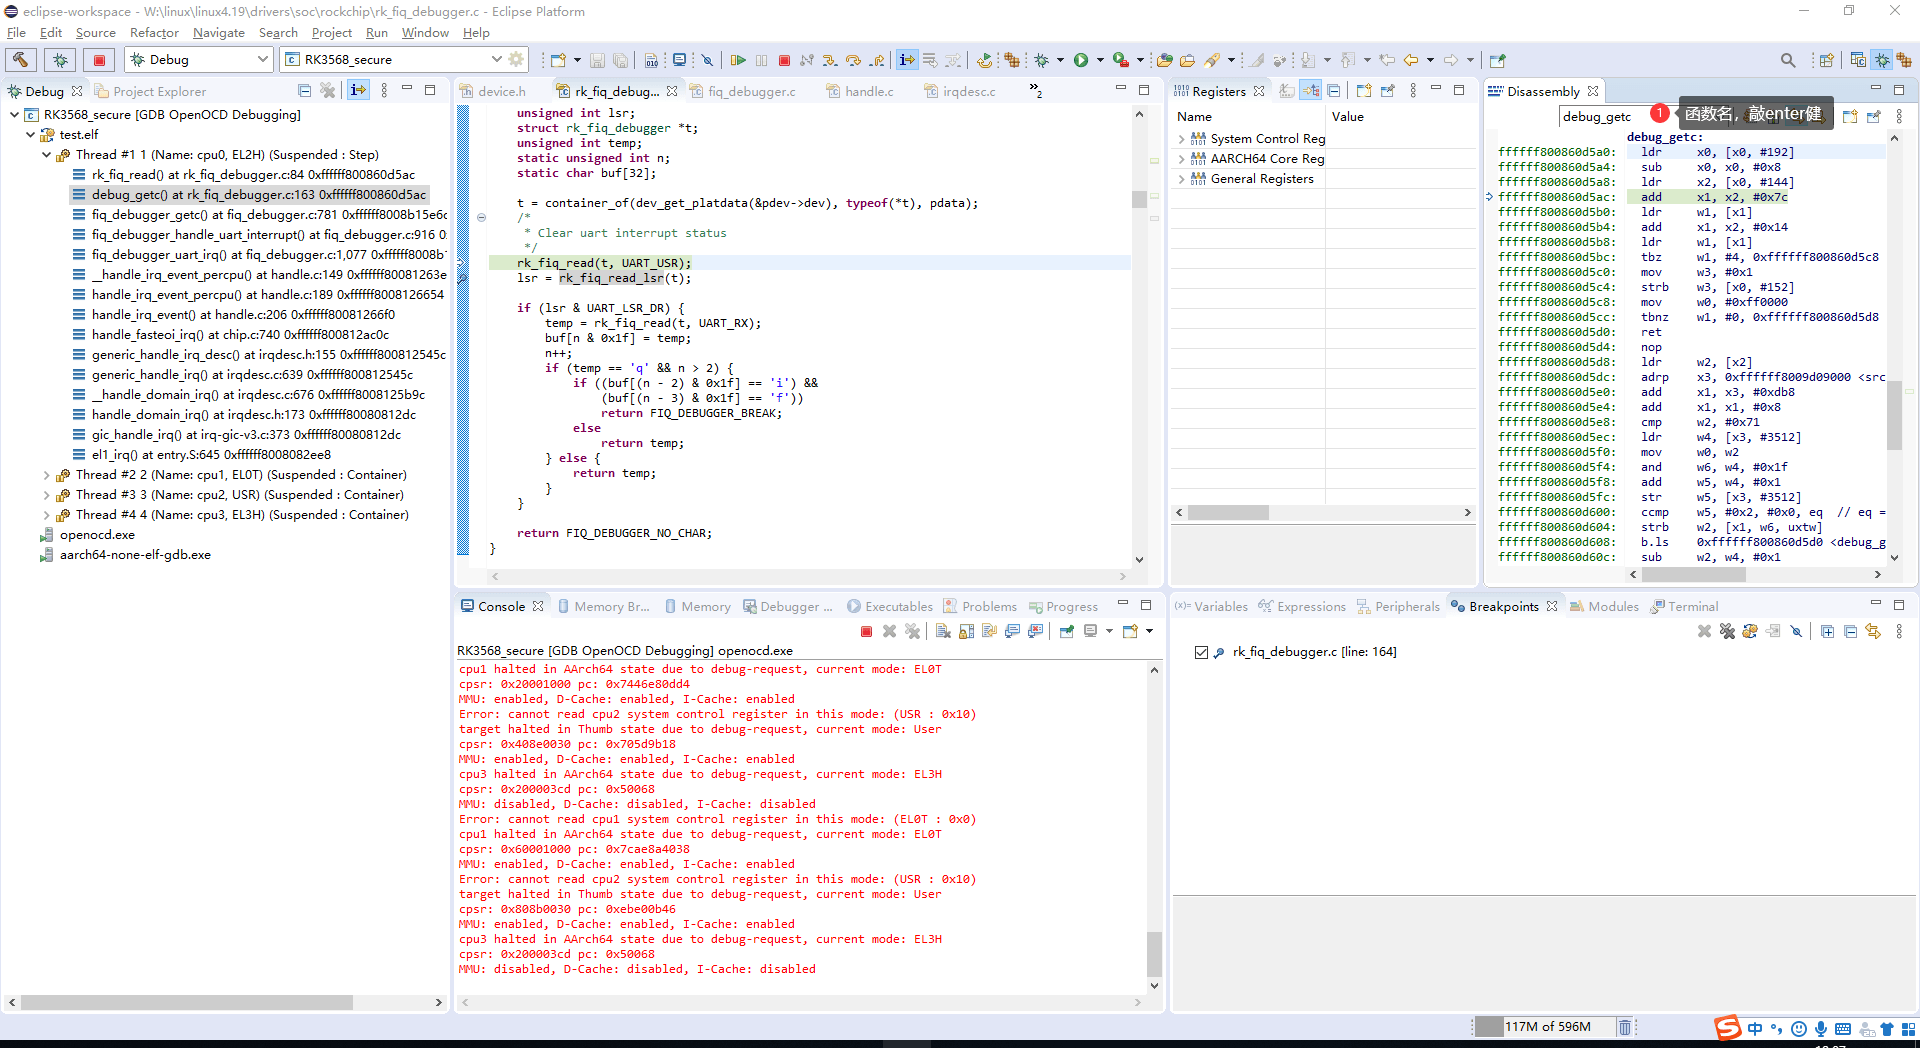
4.5 查看反汇编
可以查看调用栈函数、指定地址或某个函数的反汇编;按函数查看的前提是已经导入符号表。
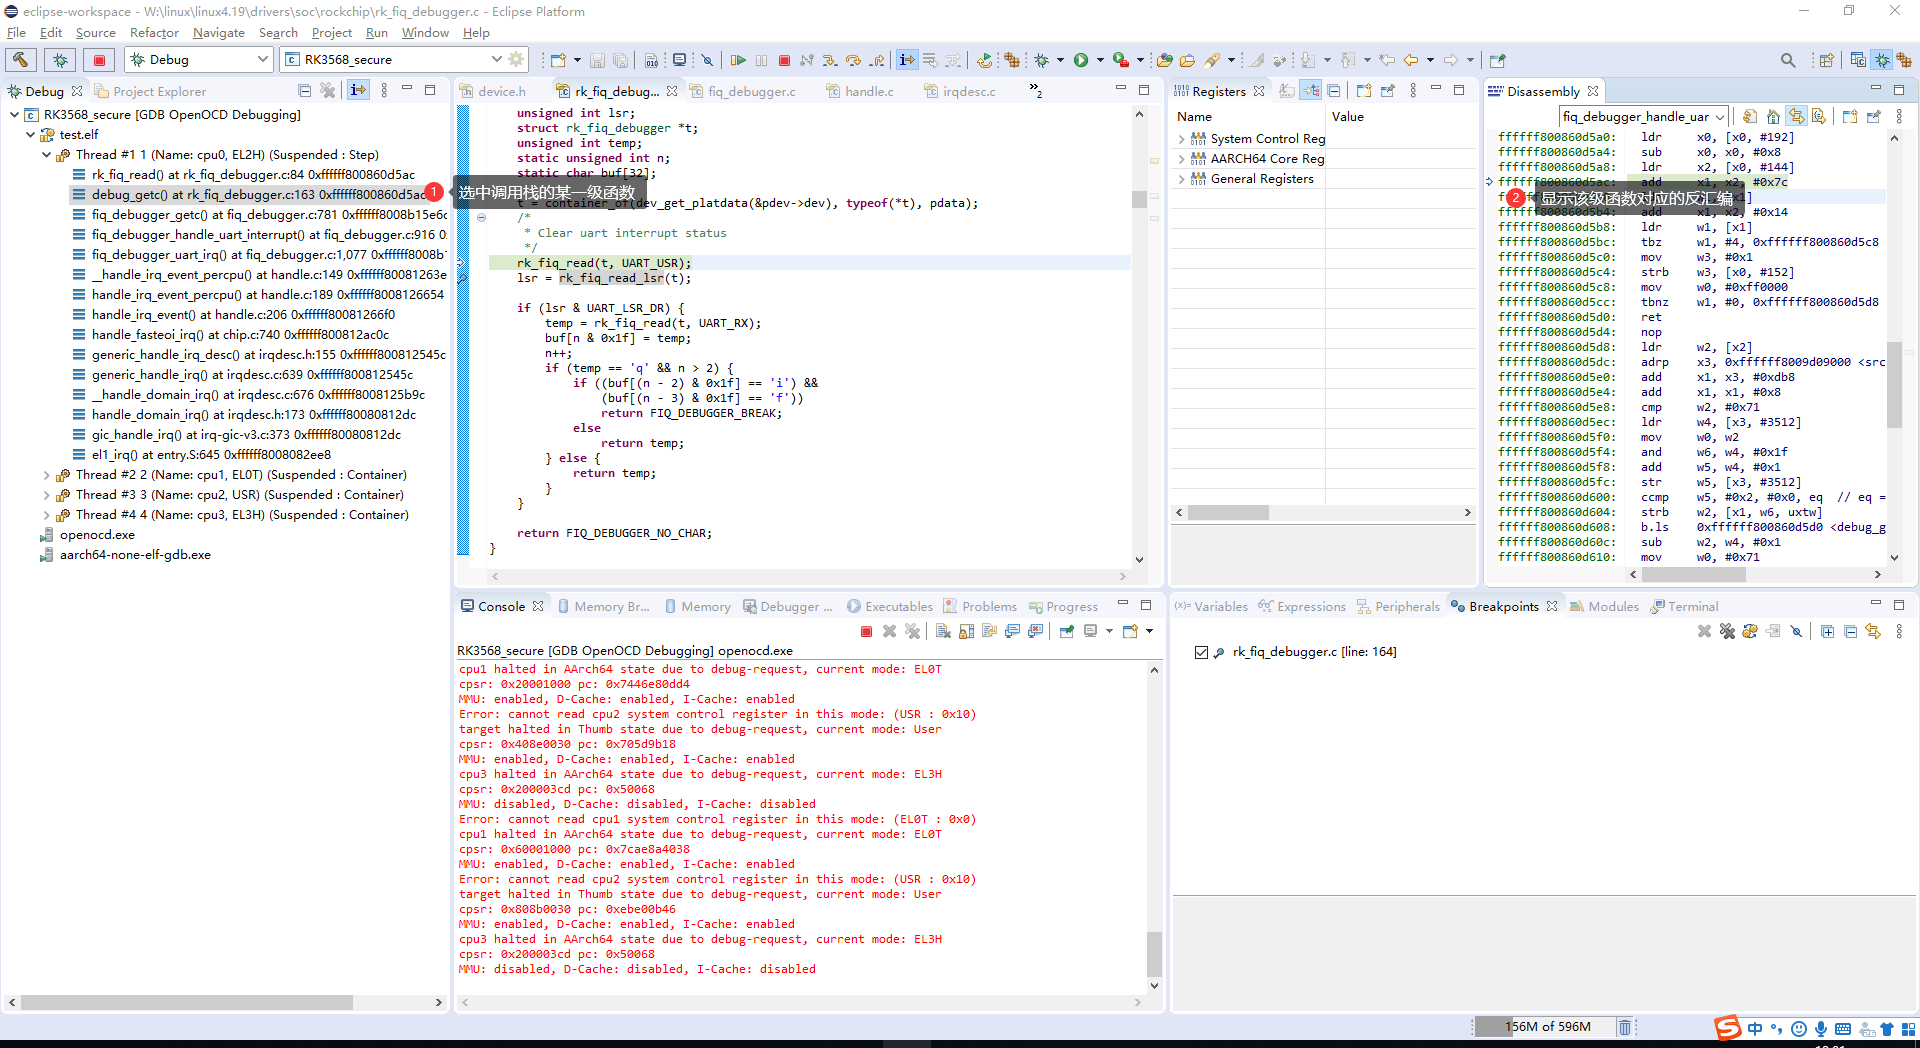
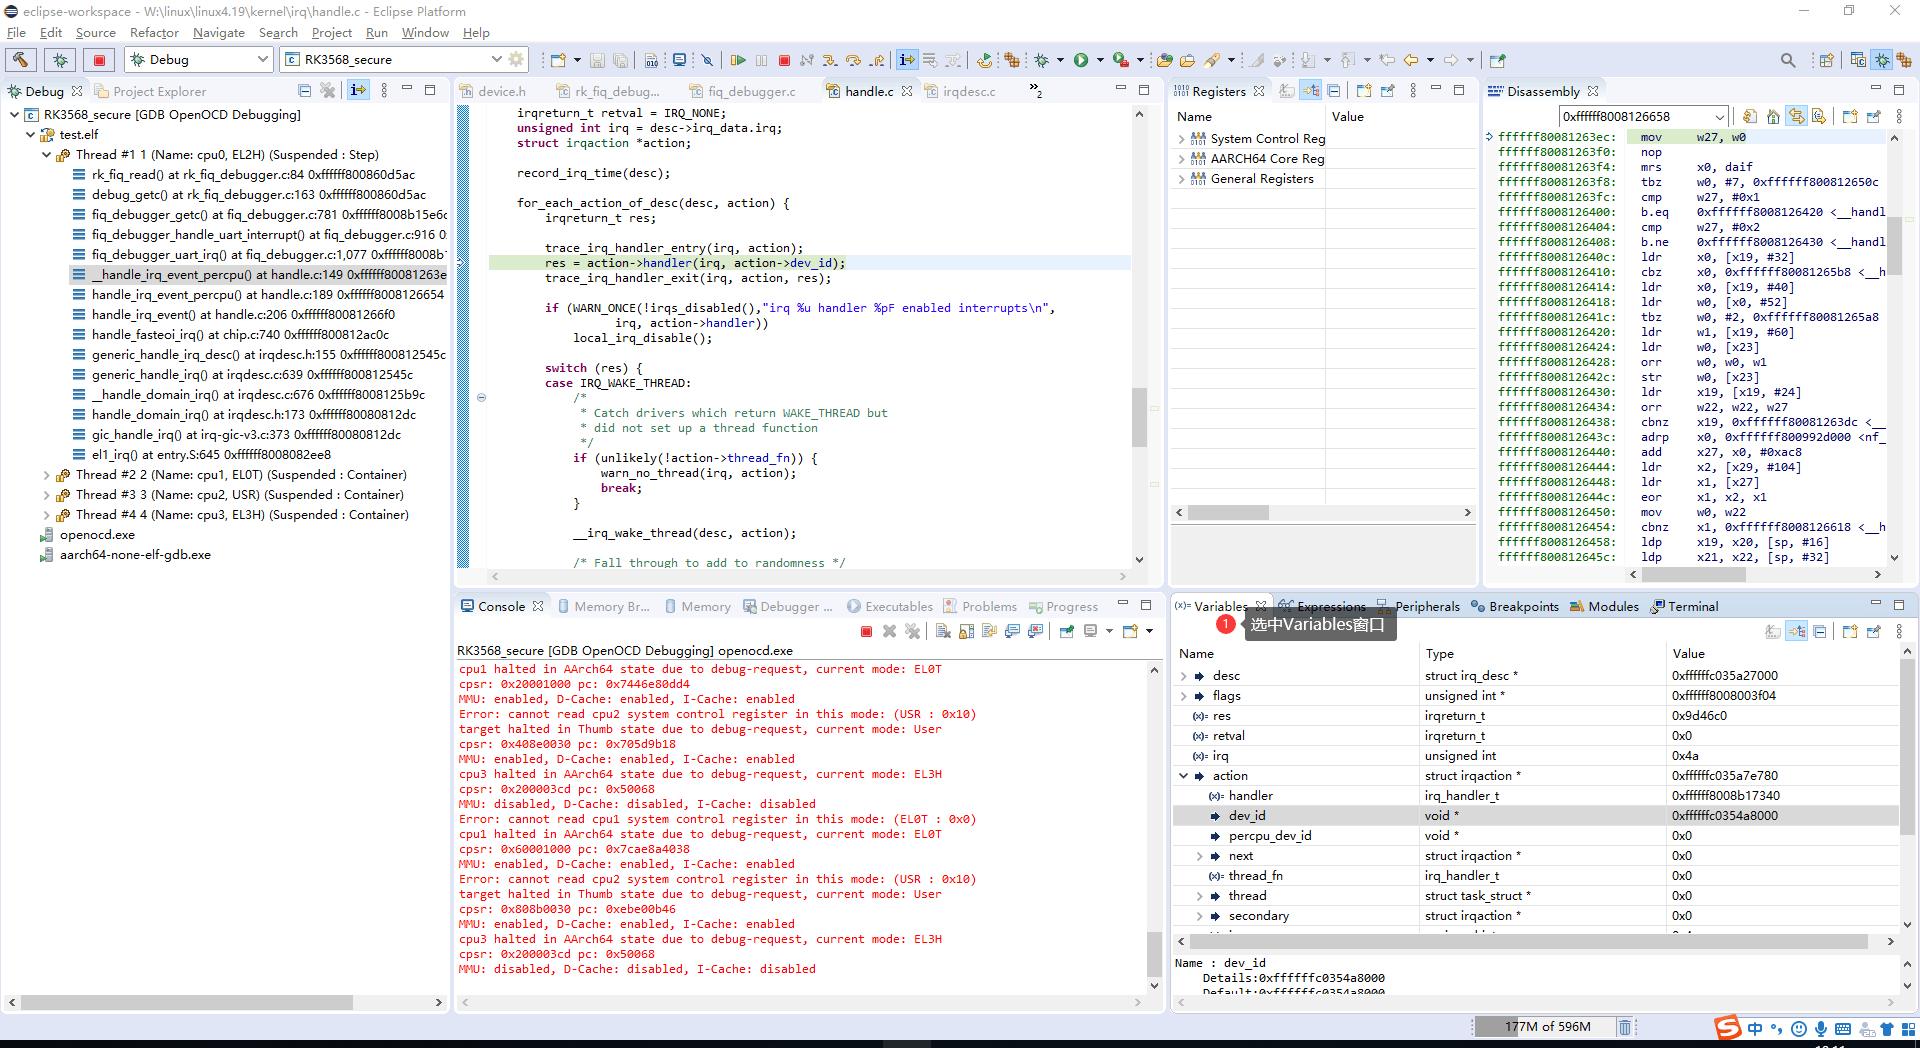
4.6 查看调用栈函数的局部变量
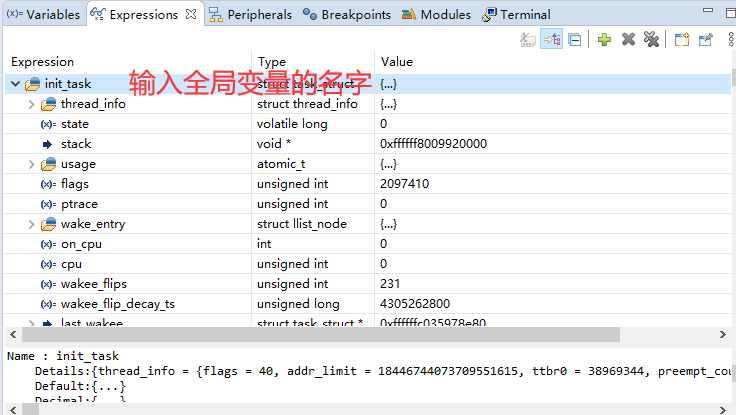
4.7 查看全局变量
在 Expressions 窗口点击 Add new expression,输入全局变量名;也可以输入指针形式的表达式。
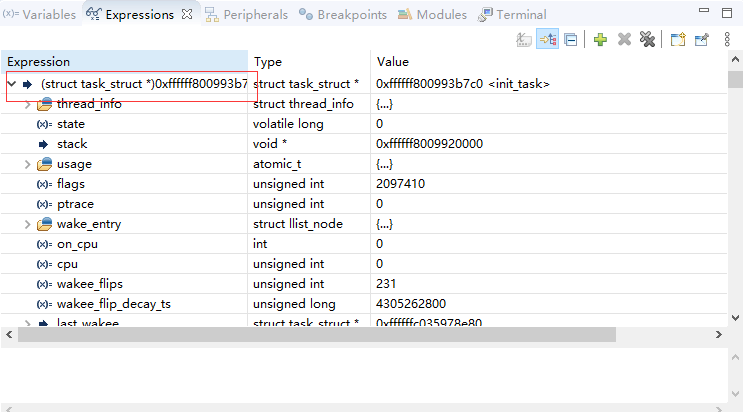
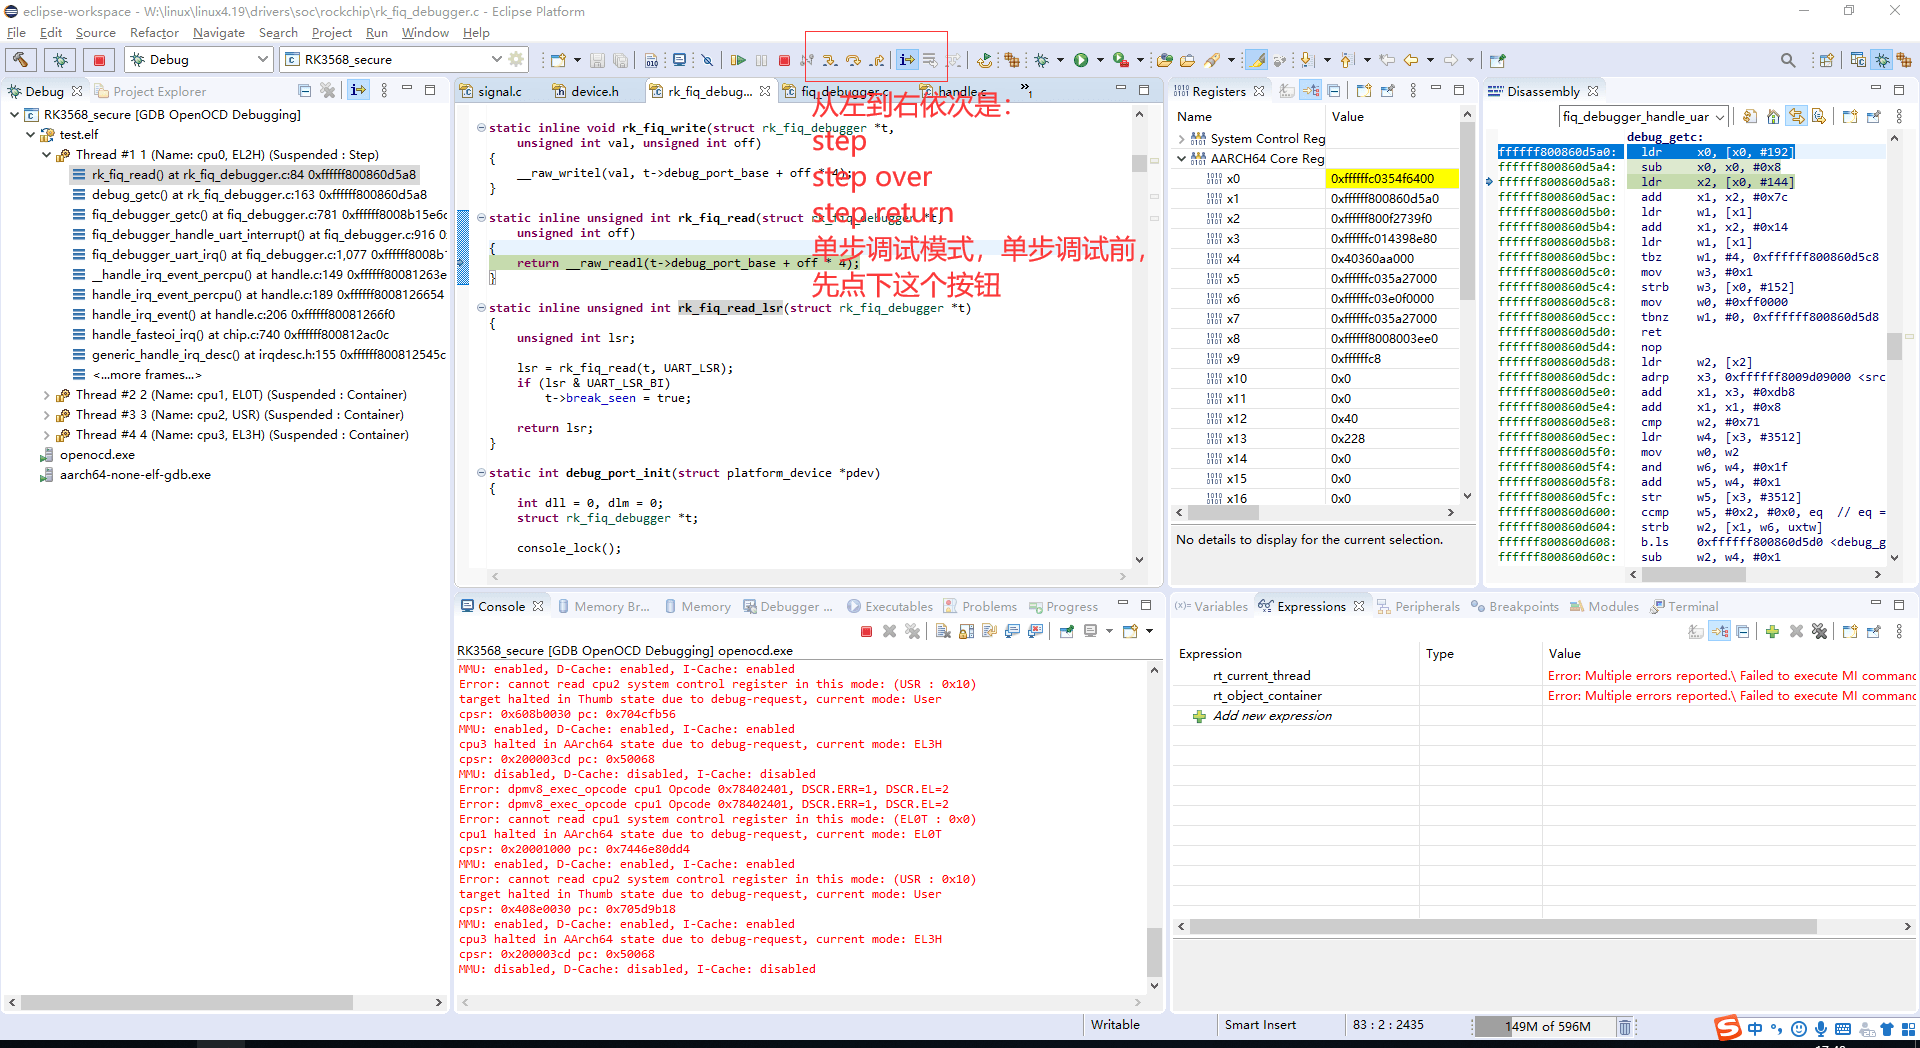
4.8 单步调试
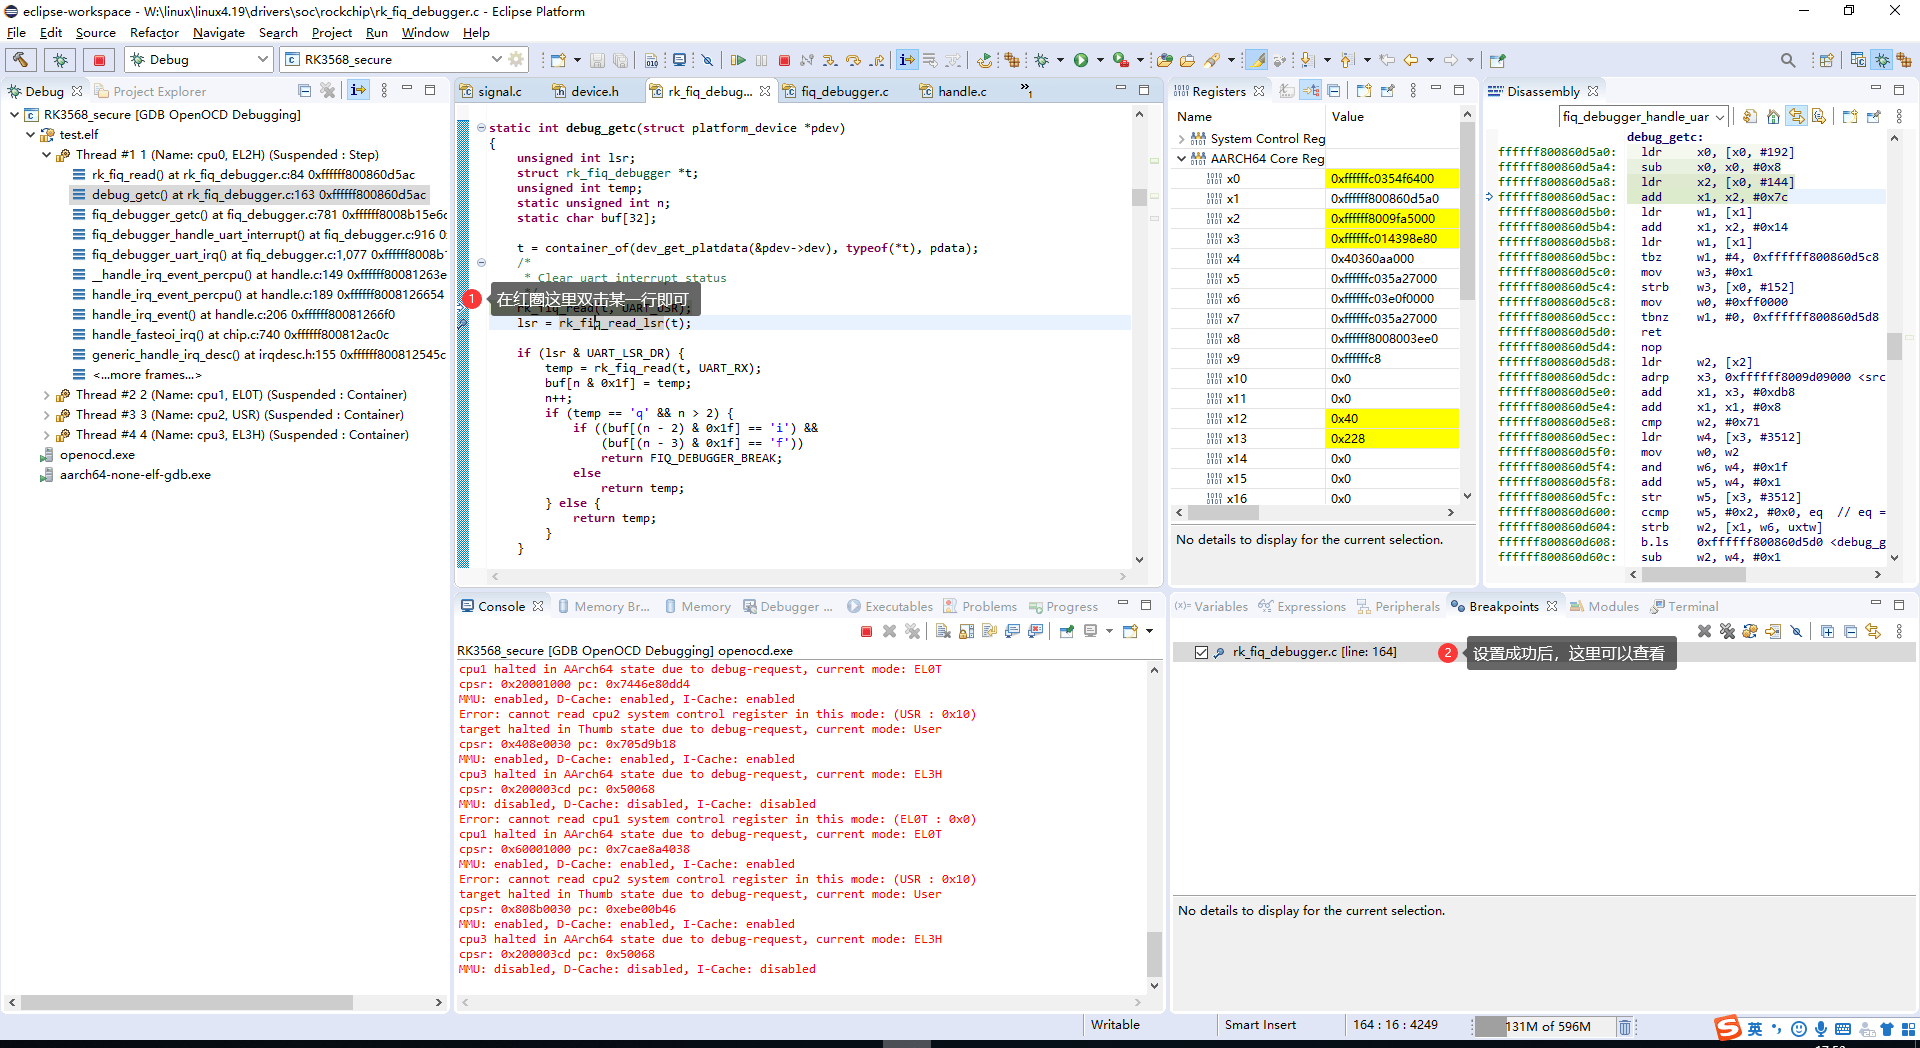
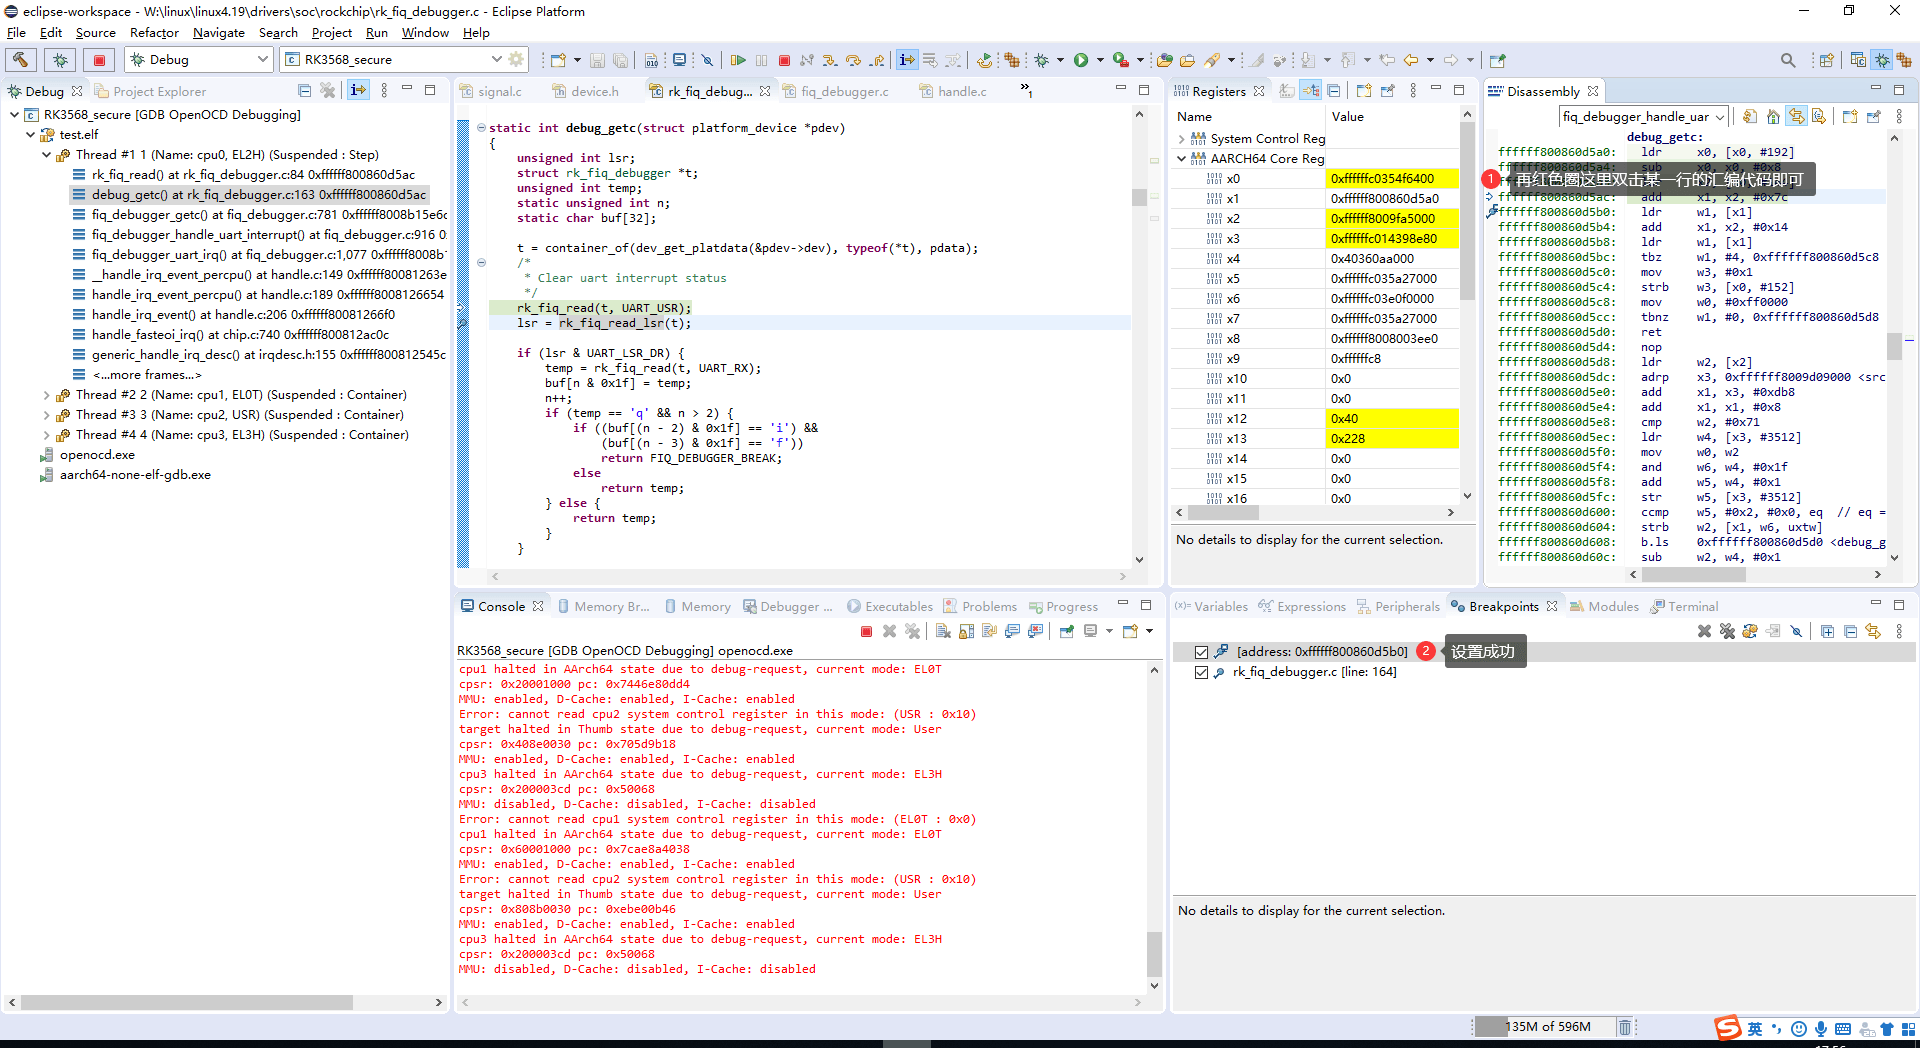
4.9 设置断点
可在源代码窗口或 Disassembly 窗口设置断点。
4.10 查看内存数据
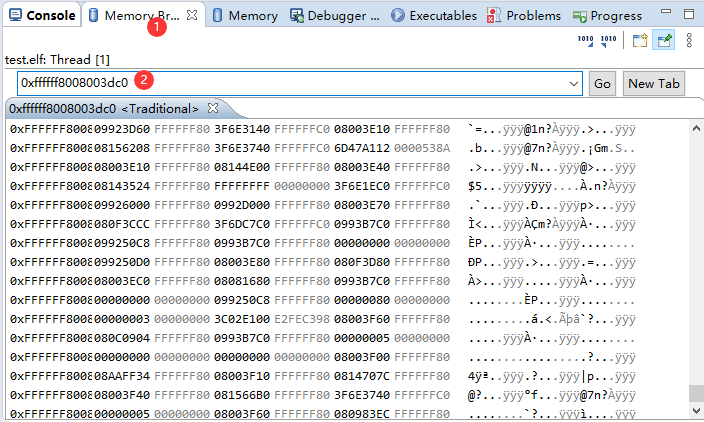
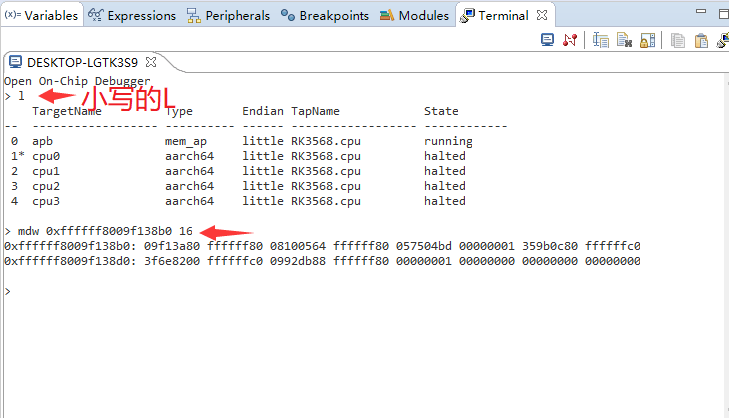
原文 Memory Browser 只正常支持 32 位地址,访问 64 位地址有问题。64 位地址请进入 OpenOCD 命令行,使用 mdw、mww、smdw、smww、io 等命令。
5. 高级调试功能
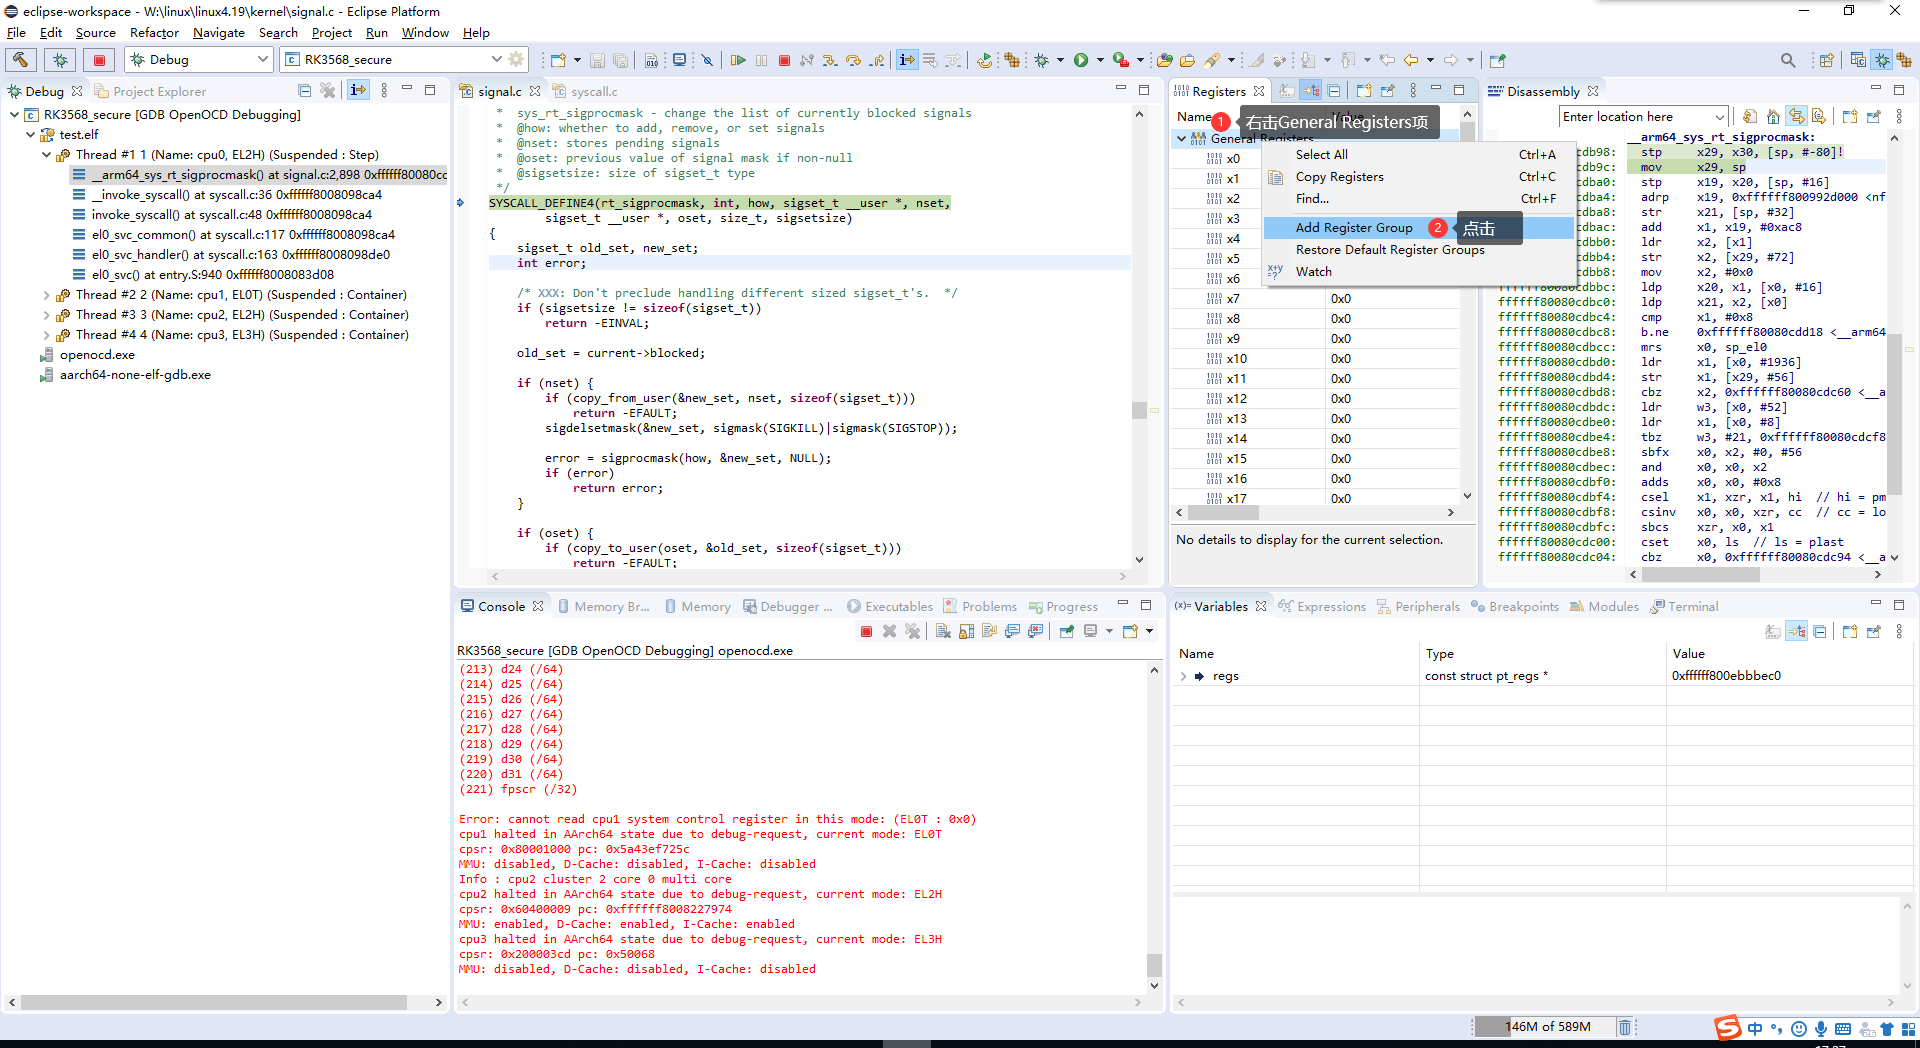
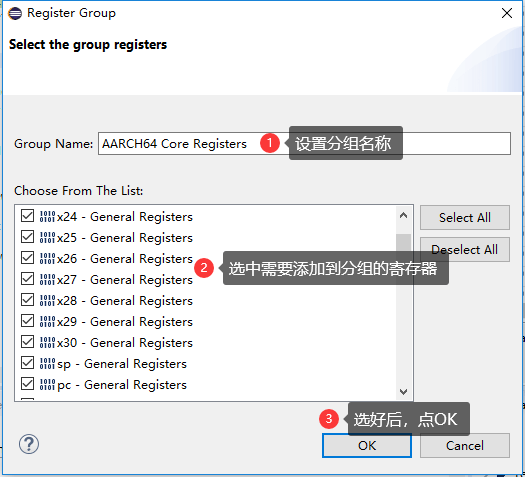
5.1 寄存器分组
寄存器较多时,分组可简化查看。
5.2 指定连接的 CPU
5.3 安全调试
若产品启用安全策略,JTAG 调试需要输入授权 key。此处仅说明工具的认证入口,不绕过安全策略。
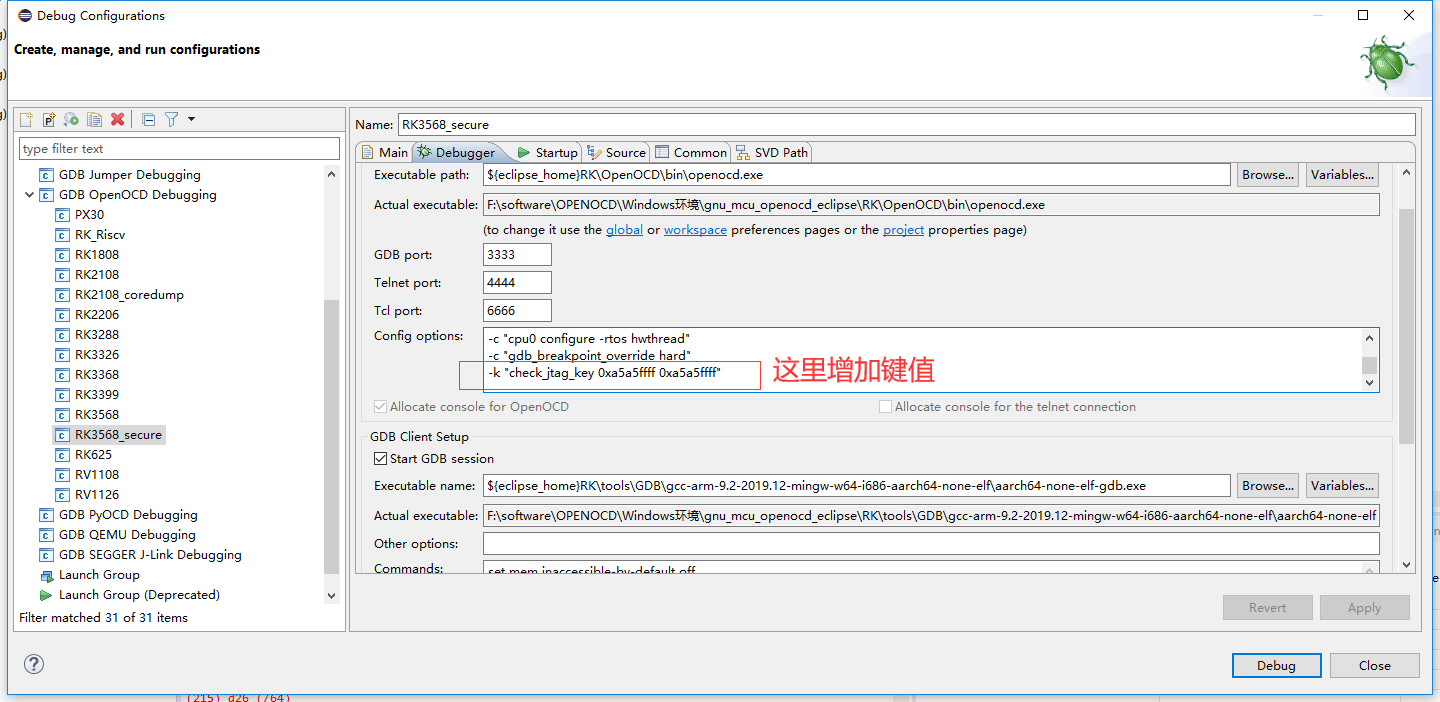
5.4 命令行终端中的 OpenOCD
在 cmd 窗口打开 OpenOCD 获取帮助;更多命令见 OpenOCD User’s Guide。原稿 openocd.exe -r 用于连接芯片。
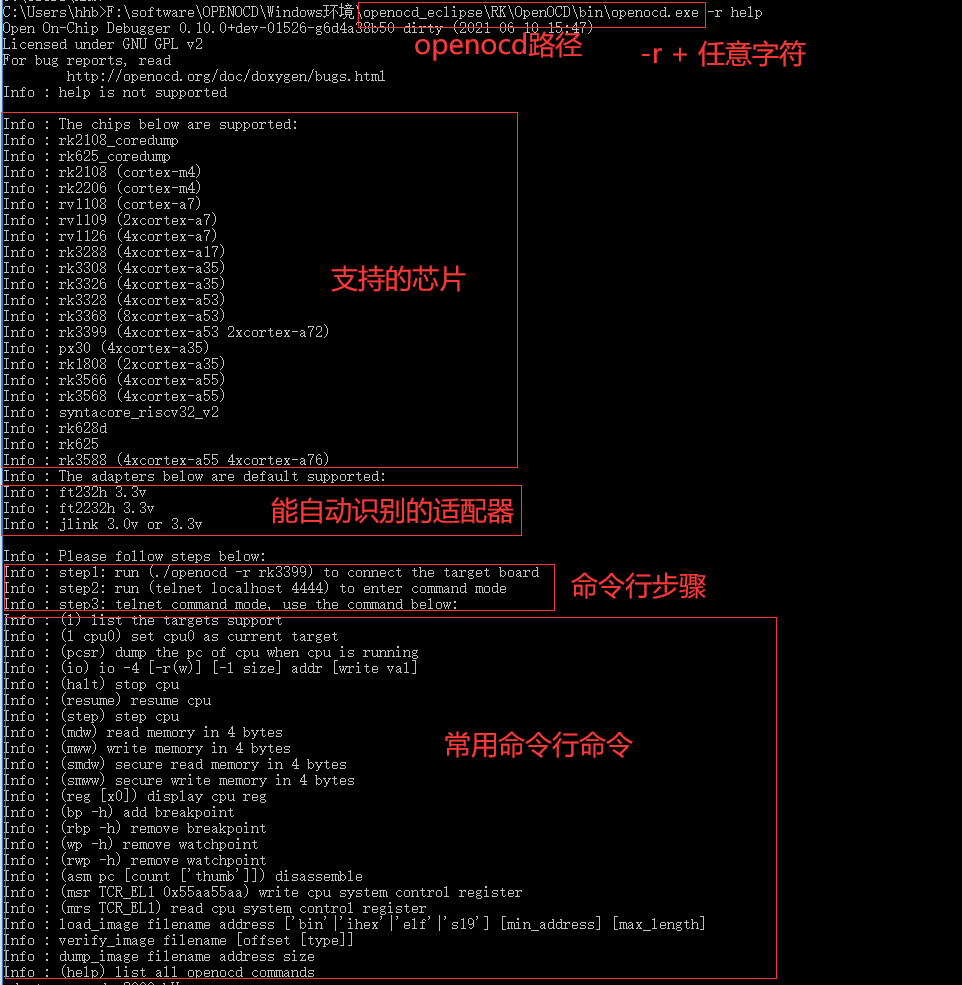
http://openocd.org/doc/html/General-Commands.html#General-Commands
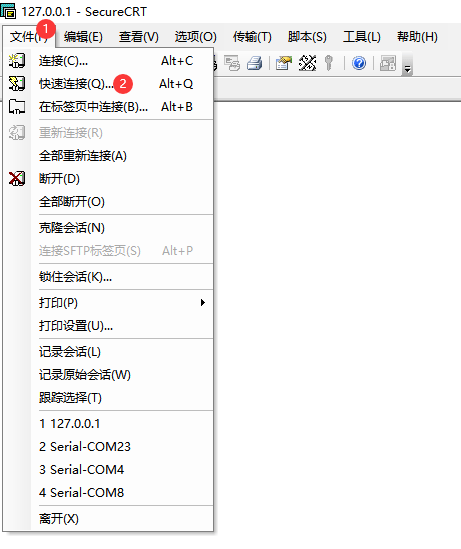
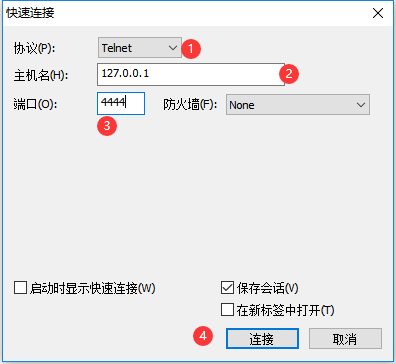
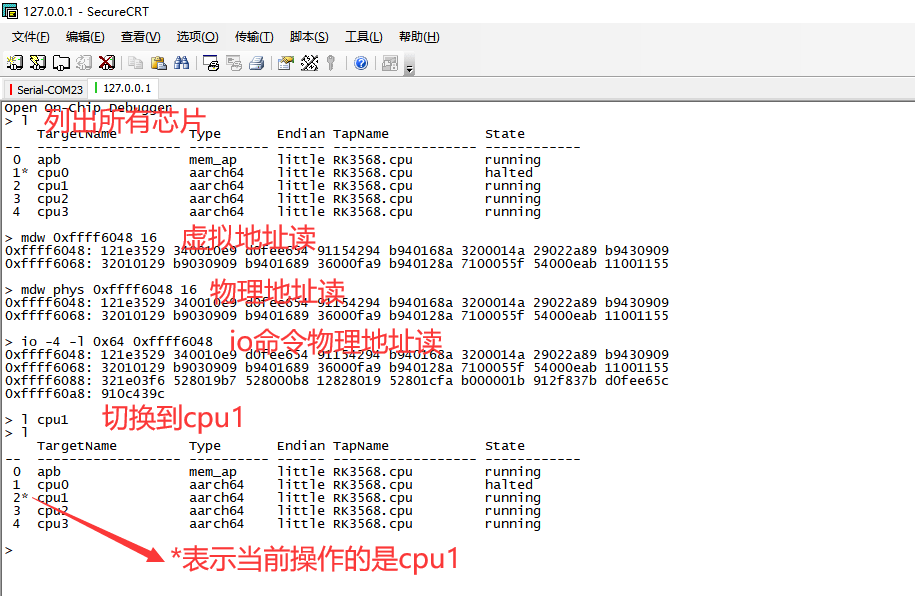
另开 cmd 窗口,执行 telnet localhost 4444 建立连接;也可用 SecureCRT 建立 Telnet 会话,配置见图。
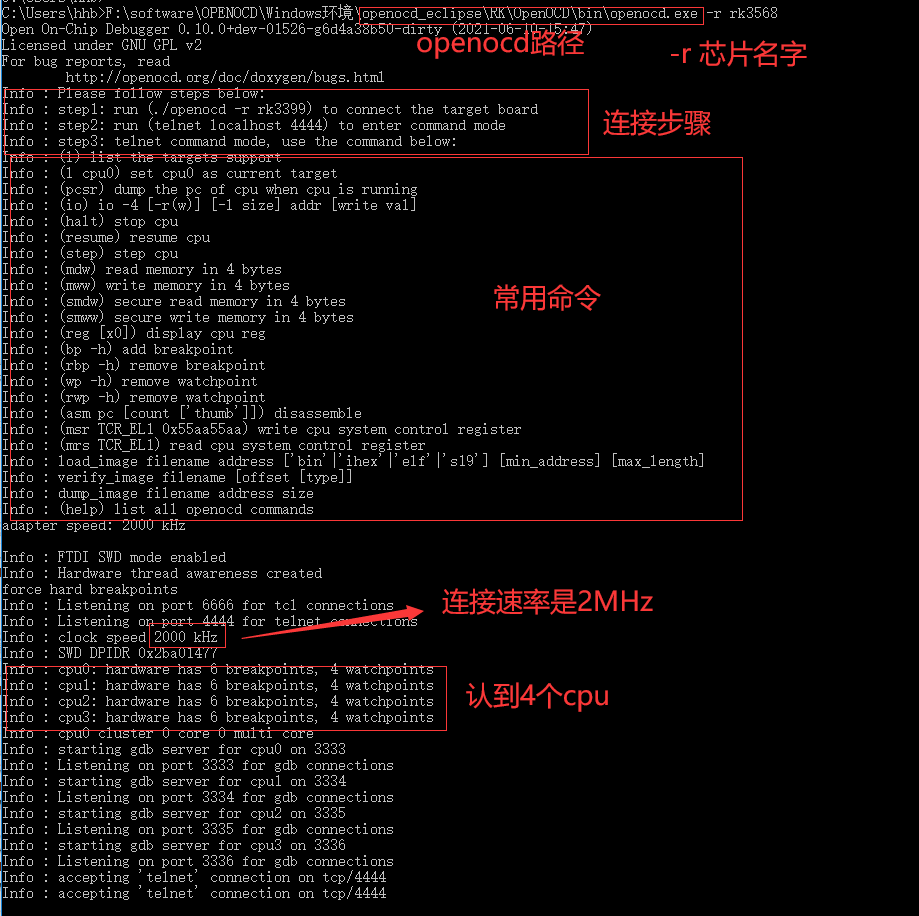
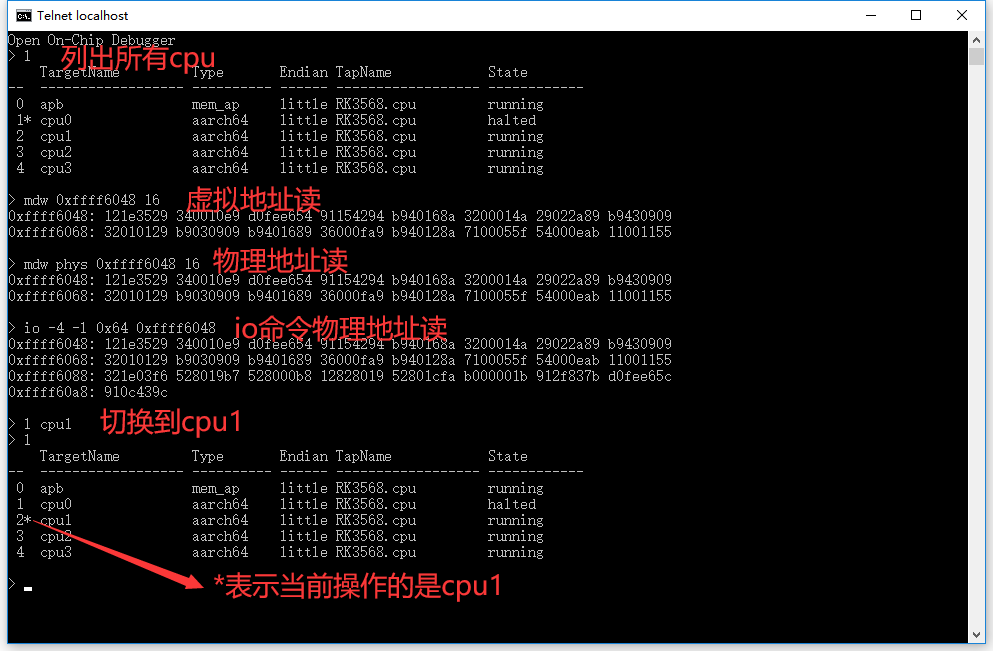
5.5 Eclipse 中的 OpenOCD 命令行
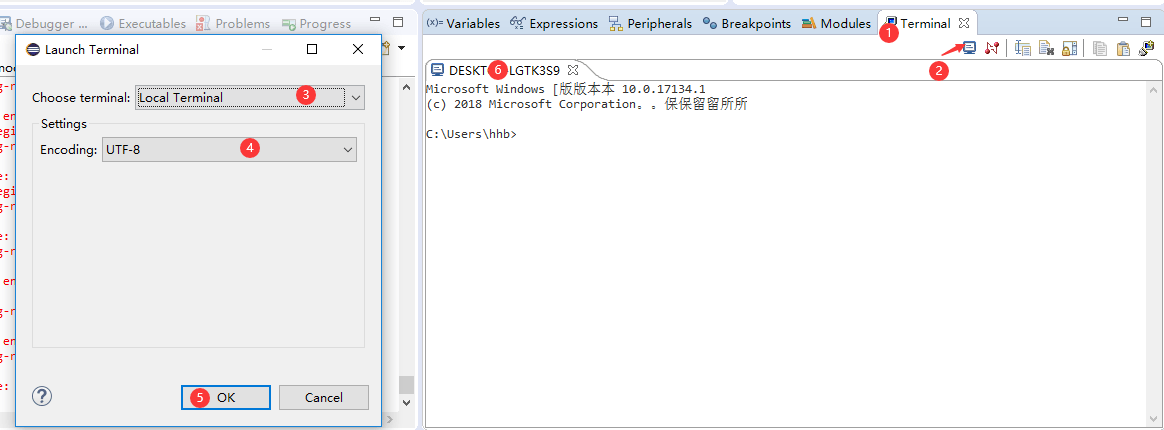
某些信息不便在 UI 查看或操作,可打开本地终端,输入 telnet localhost 4444。若命令无法识别,按 §2.1.3 启用 Windows Telnet。
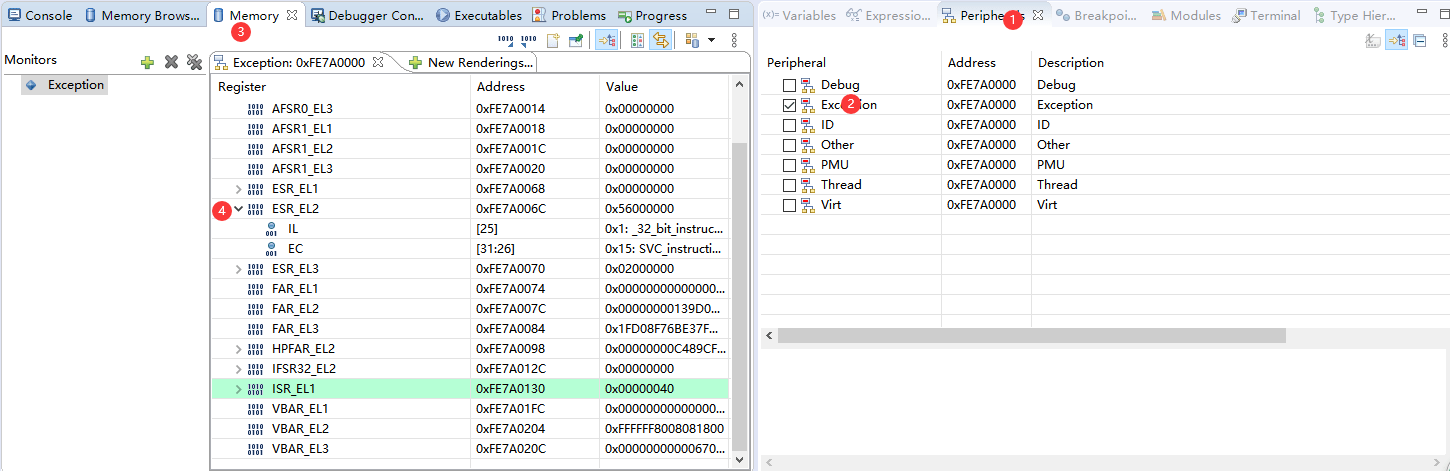
5.6 可视化查看外设寄存器
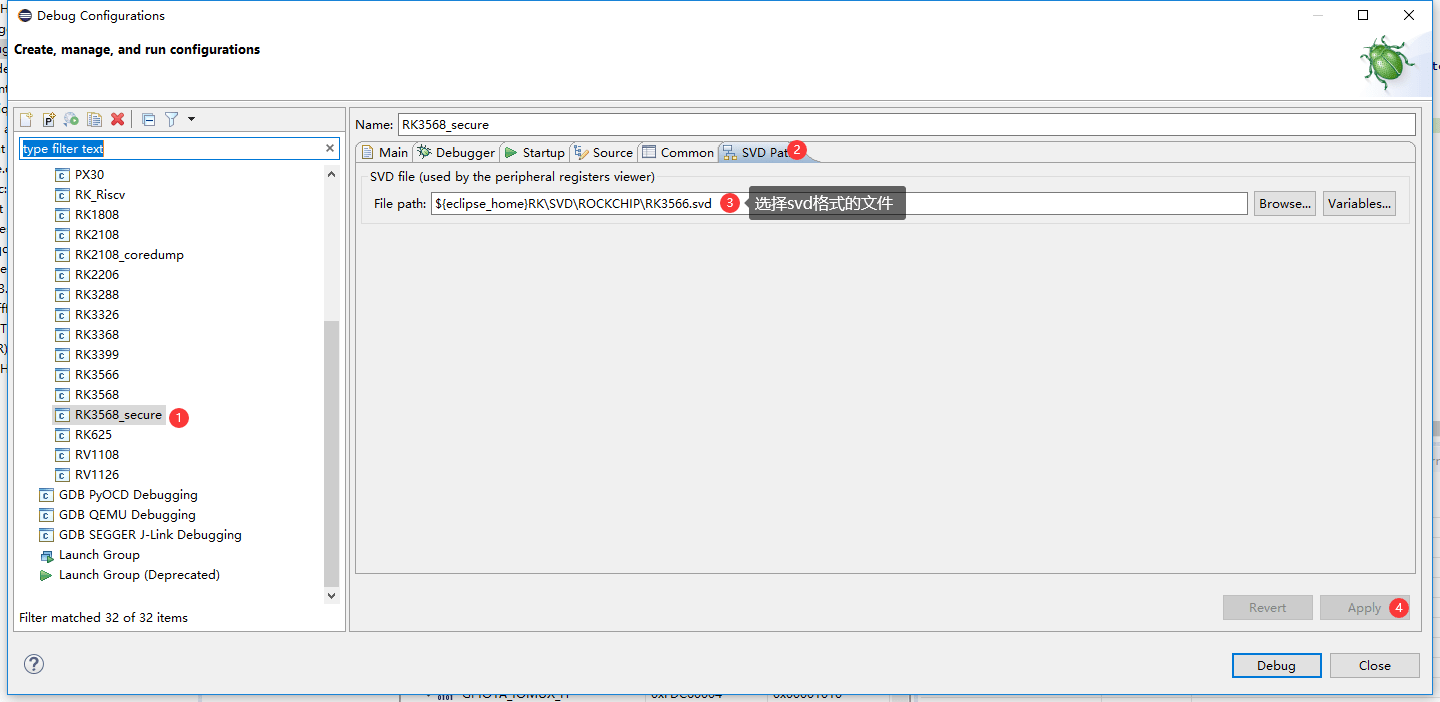
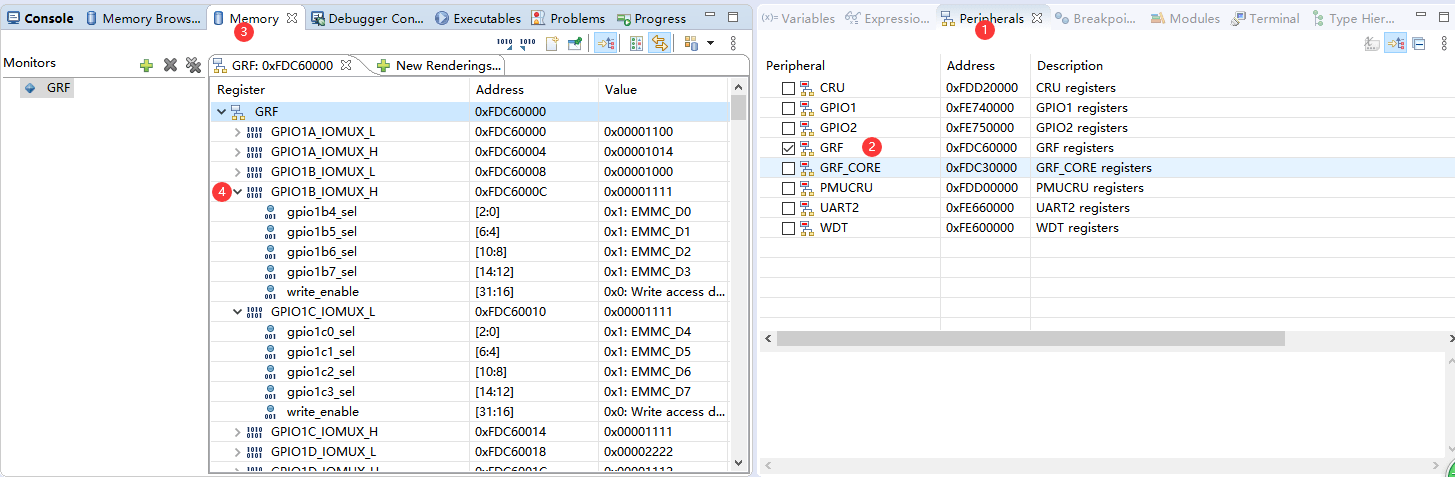
连接前选择 SVD 格式文件,再按图查看寄存器。
5.7 可视化查看系统控制寄存器
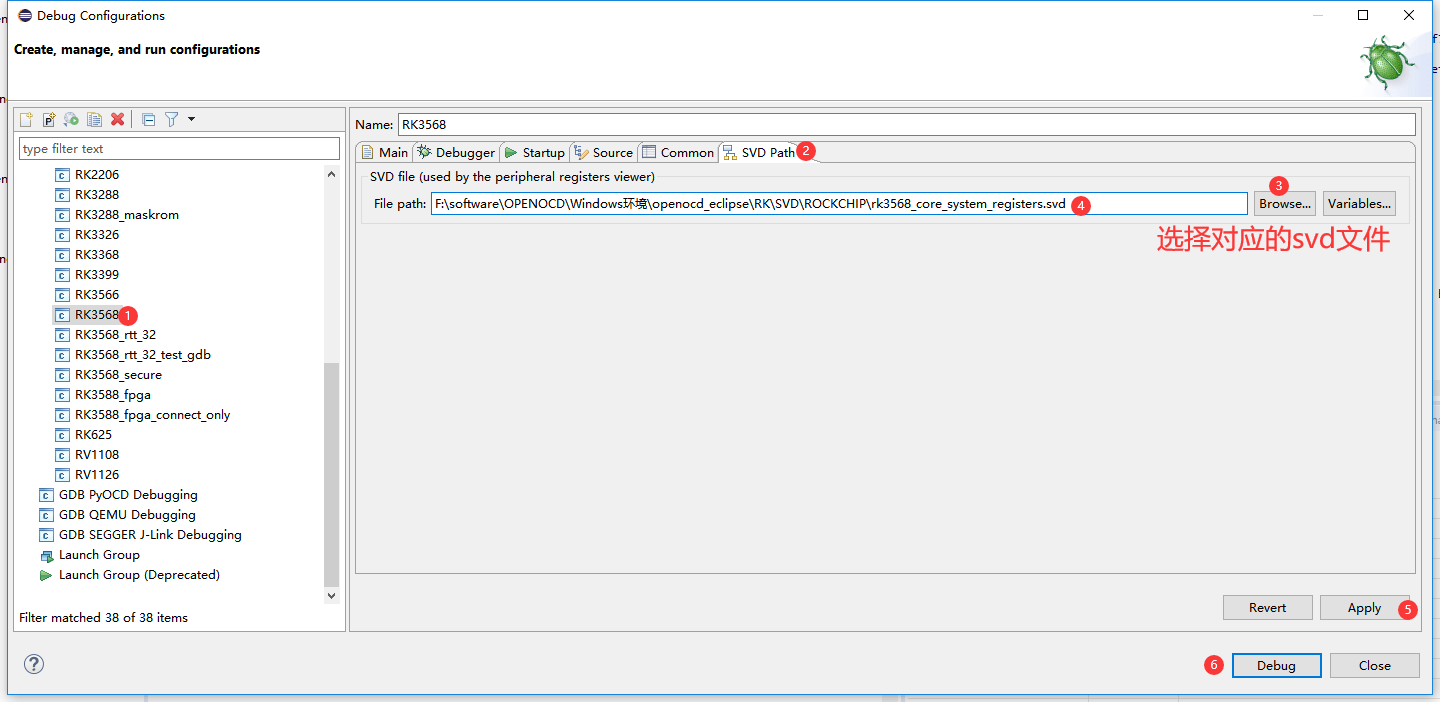
同样需要在连接前选择 SVD 文件。
5.8 从内存导出到文件
语法及原文虚拟地址、物理地址示例如下,p: 表示物理地址。输出速度是原文示例。
dump_image filename [p:]address size
 dump_image filename [p:]address size
 虚拟地址访问:

 > dump_image dd.bin 0xffffff8009a63c80 65536
 dumped 65536 bytes in 0.113187s (565.436 KiB/s)
 物理地址访问:
 > dump_image dd.bin p:0x01c63c80 65536
 dumped 65536 bytes in 0.094566s (676.776 KiB/s)
5.9 从文件导入到内存
load_image filename [p:]address ['bin'|'ihex'|'elf'|'s19'] [min_address] [max_length]
 load_image filename [p:]address ['bin'|'ihex'|'elf'|'s19'] [min_address]
 [max_length]
 虚拟地址访问:

 > load_image dd.bin 0xffffff8009a63c80 bin
 65536 bytes written at address 0xffffff8009a63c80
 downloaded 65536 bytes in 0.055928s (1144.328 KiB/s)
 物理地址访问:
 > load_image dd.bin p:0x01c63c80 bin
 65536 bytes written at address 0x01c63c80
 downloaded 65536 bytes in 0.056400s (1134.752 KiB/s)
5.10 比较文件与内存
verify_image 只支持虚拟地址访问。
verify_image filename [offset [type]]
 verify_image filename [offset [type]]
 只⽀持虚拟地址访问:
 > verify_image dd.bin 0xffffff8009a63c80

 verified 65536 bytes in 0.066775s (958.443 KiB/s)
以上三个命令涉及虚拟与物理地址。原文将 maskrom、TPL、SPL、U-Boot、ATF 环境中的虚拟地址和物理地址视为相同,因此使用虚拟地址方式即可;Linux 中两者不同,物理地址需加 p:。文件名若为相对路径,dd.bin 位于 OpenOCD 运行目录。实际地址映射仍须以目标运行状态为准。
6. 实际运用场景
6.1 调试 CPU 卡死
画面卡死、黑屏、串口无法输入命令或内核错误,可能表示 CPU 停留在某些指令。原文以 RK3399 启动卡死为例:内核日志停止、串口无响应、画面不更新。完整源日志如下。
 [  7.441882] type=1400 audit(1501952314.540:9): avc: denied { setattr } for
 pid=1 comm="init" name="mmcblk1p13" dev="tmpfs" ino=15288 scontext=u:r:init:s0
 tcontext=u:object_r:block_device:s0 tclass=lnk_file permissive=1

 [  7.455950] init: Service 'exec 2 (/system/bin/vdc)' (pid 252) exited with
 status 0
 rk3399_all:/ $ [ 7.589883] random: nonblocking pool is initialized
 [  8.078474] init: Starting service 'bootanim'...
 [  8.261358] read channel() error: -110
 [  15.245727] BUG: spinlock lockup suspected on CPU#2, adbd/251
 $ ./src/openocd.exe -r rk3399
 Open On-Chip Debugger 0.10.0+dev-01555-g6ad367fa3-dirty (2021-08-04-17:44)

 Licensed under GNU GPL v2
 For bug reports, read
       http://openocd.org/doc/doxygen/bugs.html
 中间省掉很多log
 Info : clock speed 2000 kHz
 Info : SWD DPIDR 0x5ba02477
 Info : cpu0: hardware has 6 breakpoints, 4 watchpoints
 Info : cpu1: hardware has 6 breakpoints, 4 watchpoints
 Info : cpu2: hardware has 6 breakpoints, 4 watchpoints
 Info : cpu3: hardware has 6 breakpoints, 4 watchpoints
 Info : cpu4: hardware has 6 breakpoints, 4 watchpoints
 Info : cpu5: hardware has 6 breakpoints, 4 watchpoints

 Info : starting gdb server for cpu0 on 3333
 Info : Listening on port 3333 for gdb connections
 Info : starting gdb server for cpu1 on 3334
 Info : Listening on port 3334 for gdb connections
 Info : starting gdb server for cpu2 on 3335
 Info : Listening on port 3335 for gdb connections
 Info : starting gdb server for cpu3 on 3336
 Info : Listening on port 3336 for gdb connections
 Info : starting gdb server for cpu4 on 3337
 Info : Listening on port 3337 for gdb connections
 Info : starting gdb server for cpu5 on 3338
 Info : Listening on port 3338 for gdb connections
另开终端执行 telnet localhost 4444。cpu_block 列出相关命令;l 查看 CPU 状态,dump_pc 多次读取 PC,halt 尝试停止,失败时试 fhalt。强制停止成功后可读 core_reg64/core_reg32,但原文提醒此时不能访问内存。
 另外再打开⼀个cmd窗⼝,输⼊telnet localhost 4444 进⼊命令⾏调试


 Open On-Chip Debugger
 > cpu_block 查看针对cpu卡死问题,有哪些命令可以⽤
 l 查看cpu状态
 dump_pc 多次打印pc指针
 halt 停住cpu
 if halt fail, try fhalt 强制cpu进⼊debug 状态
 if fhalt success, try core_reg64 or core_reg32, but you can't access memory
 > l
    TargetName    Type    Endian TapName    State
 -- ------------------ ---------- ------ ------------------ ------------
  0 ahb           mem_ap  little RK3399.cpu running
  1 apb           mem_ap  little RK3399.cpu running
  2* cpu0         aarch64 little RK3399.cpu running

  3 cpu1          aarch64 little RK3399.cpu running
  4 cpu2          aarch64 little RK3399.cpu running
  5 cpu3          aarch64 little RK3399.cpu running
  6 cpu4          aarch64 little RK3399.cpu running
  7 cpu5          aarch64 little RK3399.cpu running

 > dump_pc
 1
 cpu0 pc:0xffffff8008143a88
 cpu1 pc:0xffffff8008143a5c
 cpu2 pc:0xffffff8008081078
 cpu3 pc:0xffffff8008081078
 cpu4 pc:0xffffff80081133c8
 cpu5 pc:0xffffff800808248c
 2
 cpu0 pc:0xffffff8008143a88
 cpu1 pc:0xffffff8008143a5c
 cpu2 pc:0xffffff8008081078

 cpu3 pc:0xffffff8008081078
 cpu4 pc:0xffffff80081133c8
 cpu5 pc:0xffffff800808248c
 3
 cpu0 pc:0xffffff8008143a88
 cpu1 pc:0xffffff8008143a5c
 cpu2 pc:0xffffff8008081078
 cpu3 pc:0xffffff8008081078
 cpu4 pc:0xffffff80081133c8
 cpu5 pc:0xffffff800808248c
 4
 cpu0 pc:0xffffff8008143a88
 cpu1 pc:0xffffff8008143a5c

 cpu2 pc:0xffffff8008081078
 cpu3 pc:0xffffff8008081078
 cpu4 pc:0xffffff80081133c8
 cpu5 pc:0xffffff800808248c
 5
 cpu0 pc:0xffffff8008143a88
 cpu1 pc:0xffffff8008143a5c
 cpu2 pc:0xffffff8008081078
 cpu3 pc:0xffffff8008081078
 cpu4 pc:0xffffff80081133c8
 cpu5 pc:0xffffff800808248c 经过5次打印,发现6个cpu的pc指针都没变,那么很可能是卡死了


 > halt
 Timeout waiting for target cpu0 halt 第⼀次尝试停cpu0失败

 > fhalt
 cpu0 fail to force entry to debug state; prsr:00000001 第⼆次尝试停cpu0失败,这时只能
 根据打印出来的pc指针来查问题了

 > l cpu1

 > halt
 Timeout waiting for target cpu1 halt

 > fhalt

 cpu1 fail to force entry to debug state; prsr:00000001
 > l cpu2
 > halt
 Timeout waiting for target cpu2 halt

 > fhalt

 cpu2 success to force entry to debug state; prsr:00000011 终于可以停住cpu2

 > core_reg64 可以打印cpu通⽤寄存器,以便进⼀步分析
 x0 (/64): 0xffffffc00a3d7e00
 x1 (/64): 0xffffff8008081028
 x2 (/64): 0x0000000000000000
 x3 (/64): 0x00000040edbb6000
 x4 (/64): 0x0100000000000000
 x5 (/64): 0x000000000d8031bf
 x6 (/64): 0x000000000000126a
 x7 (/64): 0xffffff8008141ee0
 x8 (/64): 0x0000000000000000

 x9 (/64): 0x0000000000000000
 x10 (/64): 0x00000000000012b0
 x11 (/64): 0x000000000000000f
 x12 (/64): 0x0000000100000000
 x13 (/64): 0x0000000000000001
 x14 (/64): 0x0000000000000000
 x15 (/64): 0x0000000000000000
 x16 (/64): 0xffffff80080b8b28
 x17 (/64): 0x0000007cf3aeee00
 x18 (/64): 0x0000000000000000
 x19 (/64): 0x000000000000001e
 x20 (/64): 0x0000008000000000
 x21 (/64): 0xffffff80094e7990

 x22 (/64): 0xffffff8009357ea0
 x23 (/64): 0xffffffc00a3d7e00
 x24 (/64): 0x0000000000000001
 x25 (/64): 0xffffffc0f6ed4060
 x26 (/64): 0xffffffc0f6ed8050
 x27 (/64): 0x0000000000ed9234
 x28 (/64): 0xffffffc00a3cad00
 x29 (/64): 0xffffffc0f6ed8000
 x30 (/64): 0xffffff8008083230
 sp (/64): 0xffffffc0f6ed8000
 pc (/64): 0xffffff800808107c


 > mrs SCTLR_EL1 也可以读system control寄存器
 Cannot reach EL 0, SPSR corrupted?
 SCTLR_EL1:0x34d5d91d

 > mrs SCTLR_EL2
 Cannot reach EL 0, SPSR corrupted?
 SCTLR_EL2:0x30c50830

 > mrs SCTLR_EL3
 Cannot reach EL 0, SPSR corrupted?
 SCTLR_EL3:0x00cd383f
原例 5 次采样中 6 个 CPU 的 PC 均不变,因而怀疑卡死;CPU0/CPU1 强制停止失败,CPU2 成功。core_reg64 打印通用寄存器,mrs SCTLR_EL1/EL2/EL3 读取系统控制寄存器。随后执行 objdump.exe -d vmlinux | less,定位 PC 所在函数和指令。原例标记 CPU2 停在 0xffffff800808107c 的 dsb sy。
 执⾏objdump.exe -d vmlinux | less,反汇编查看pc指针所处的函数和指令

 ffffff8008081028 <gic_handle_irq>:
 ffffff8008081028: a9bc7bfd   stp   x29, x30, [sp, #-64]!
 ffffff800808102c: 910003fd   mov   x29, sp
 ffffff8008081030: a9025bf5   stp   x21, x22, [sp, #32]

 ffffff8008081034: d00096b6   adrp  x22, ffffff8009357000
 <event_hash+0x288>
 ffffff8008081038: a90363f7   stp   x23, x24, [sp, #48]
 ffffff800808103c: d000a335   adrp  x21, ffffff80094e7000
 <event_class_drv_config+0x40>
 ffffff8008081040: aa0003f7   mov   x23, x0
 ffffff8008081044: 913a82d6   add   x22, x22, #0xea0
 ffffff8008081048: 912642b5   add   x21, x21, #0x990
 ffffff800808104c: a90153f3   stp   x19, x20, [sp, #16]
 ffffff8008081050: 52800038   mov   w24, #0x1
 // #1
 ffffff8008081054: d503201f   nop

 ffffff8008081058: 14000008   b     ffffff8008081078
 <gic_handle_irq+0x50>
 ffffff800808105c: 71003e7f   cmp   w19, #0xf
 ffffff8008081060: 540007e8   b.hi  ffffff800808115c
 <gic_handle_irq+0x134> // b.pmore
 ffffff8008081064: 92407e60   and   x0, x19, #0xffffffff
 ffffff8008081068: d518cc20   msr   s3_0_c12_c12_1, x0
 ffffff800808106c: d5033fdf   isb
 ffffff8008081070: d503201f   nop
 ffffff8008081074: 14000035   b     ffffff8008081148
 <gic_handle_irq+0x120>
 ffffff8008081078: d538cc13   mrs   x19, s3_0_c12_c12_0
 *ffffff800808107c: d5033f9f   dsb  sy   cpu2卡死在这个位置

 ffffff8008081080: 51004260   sub   w0, w19, #0x10
 ffffff8008081084: 2a1303f4   mov   w20, w19
 ffffff8008081088: 710fac1f   cmp   w0, #0x3eb
 ffffff800808108c: 54000089   b.ls  ffffff800808109c
 <gic_handle_irq+0x74> // b.plast
 ffffff8008081090: 5283ffe0   mov   w0, #0x1fff
 // #8191
 ffffff8008081094: 6b00027f   cmp   w19, w0
 ffffff8008081098: 54fffe29   b.ls  ffffff800808105c
 <gic_handle_irq+0x34> // b.plast
若仍无法确定原因,原文建议将这些命令的日志交给 Rockchip 工程师分析。
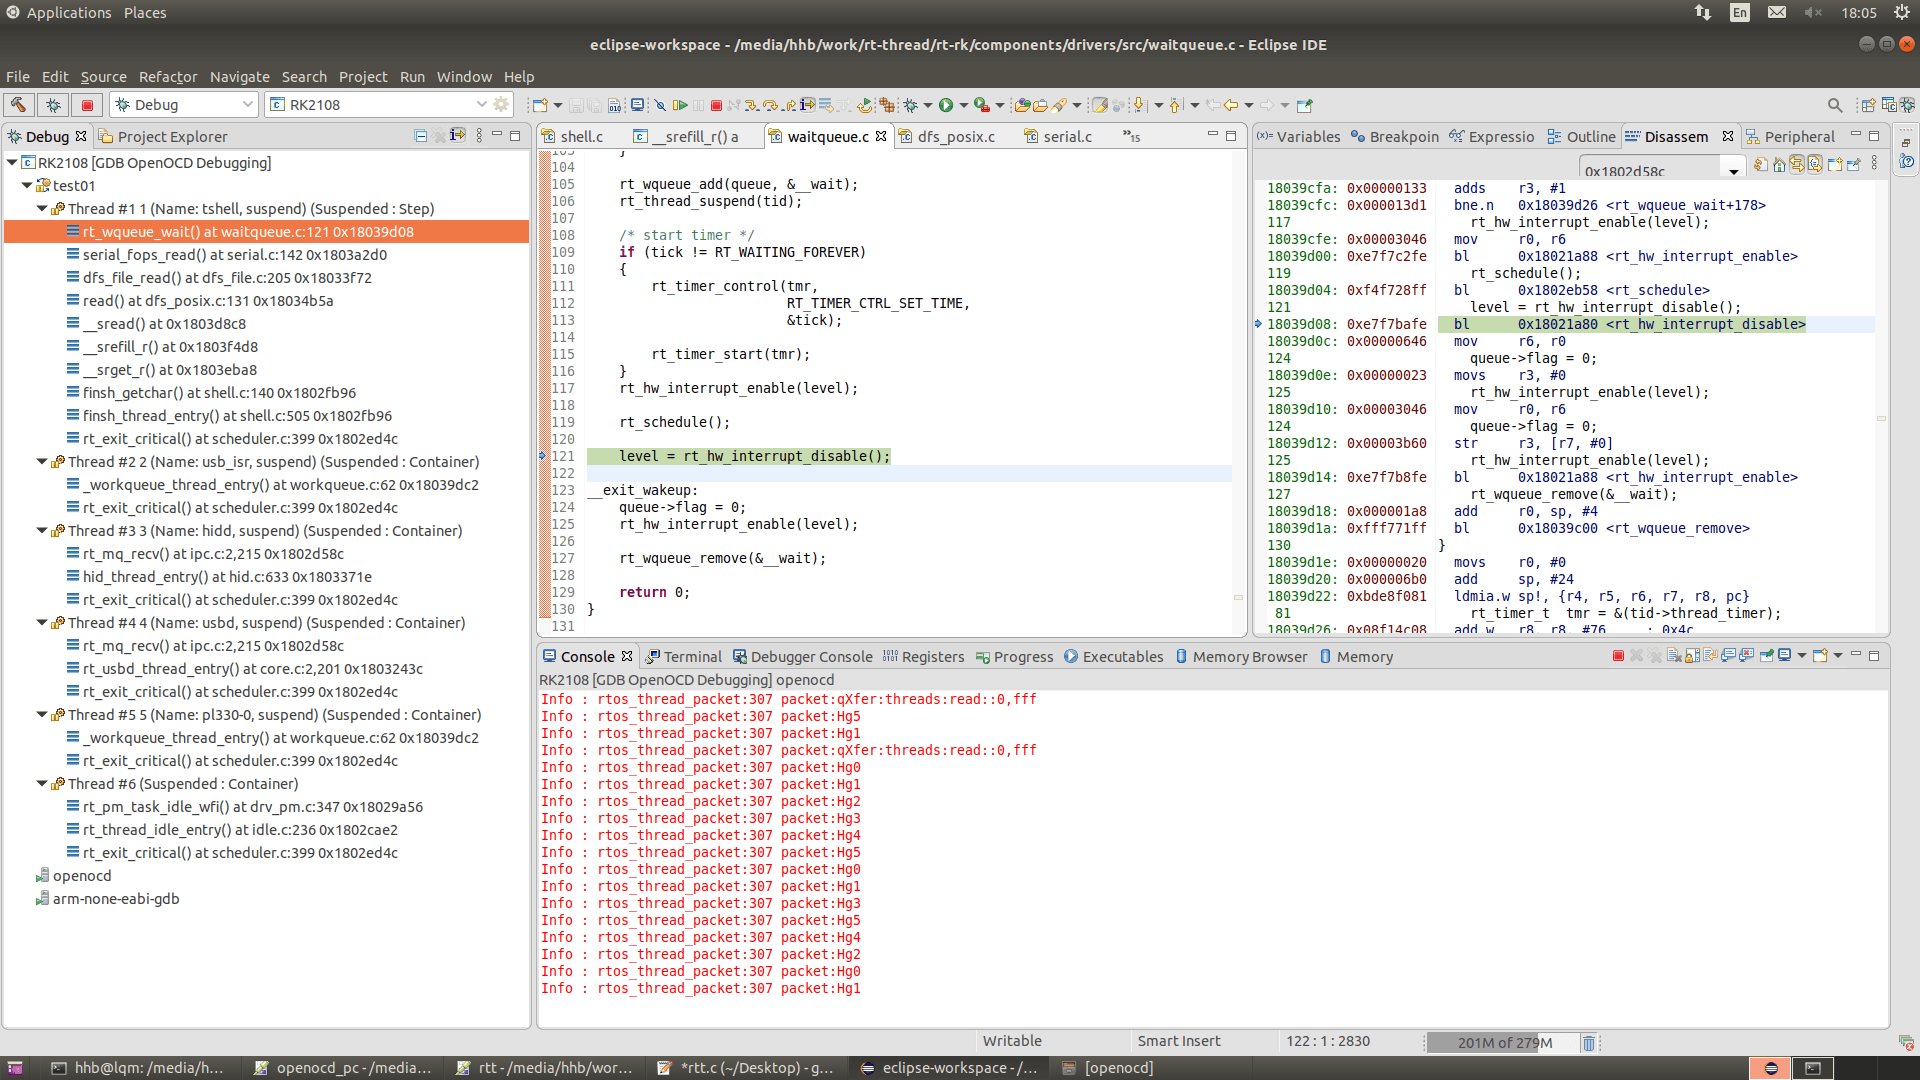
6.2 RT-Thread 调试
默认仅显示一个线程,添加以下配置后可显示多线程:
-c "cpu0 configure -rtos RT_Thread"
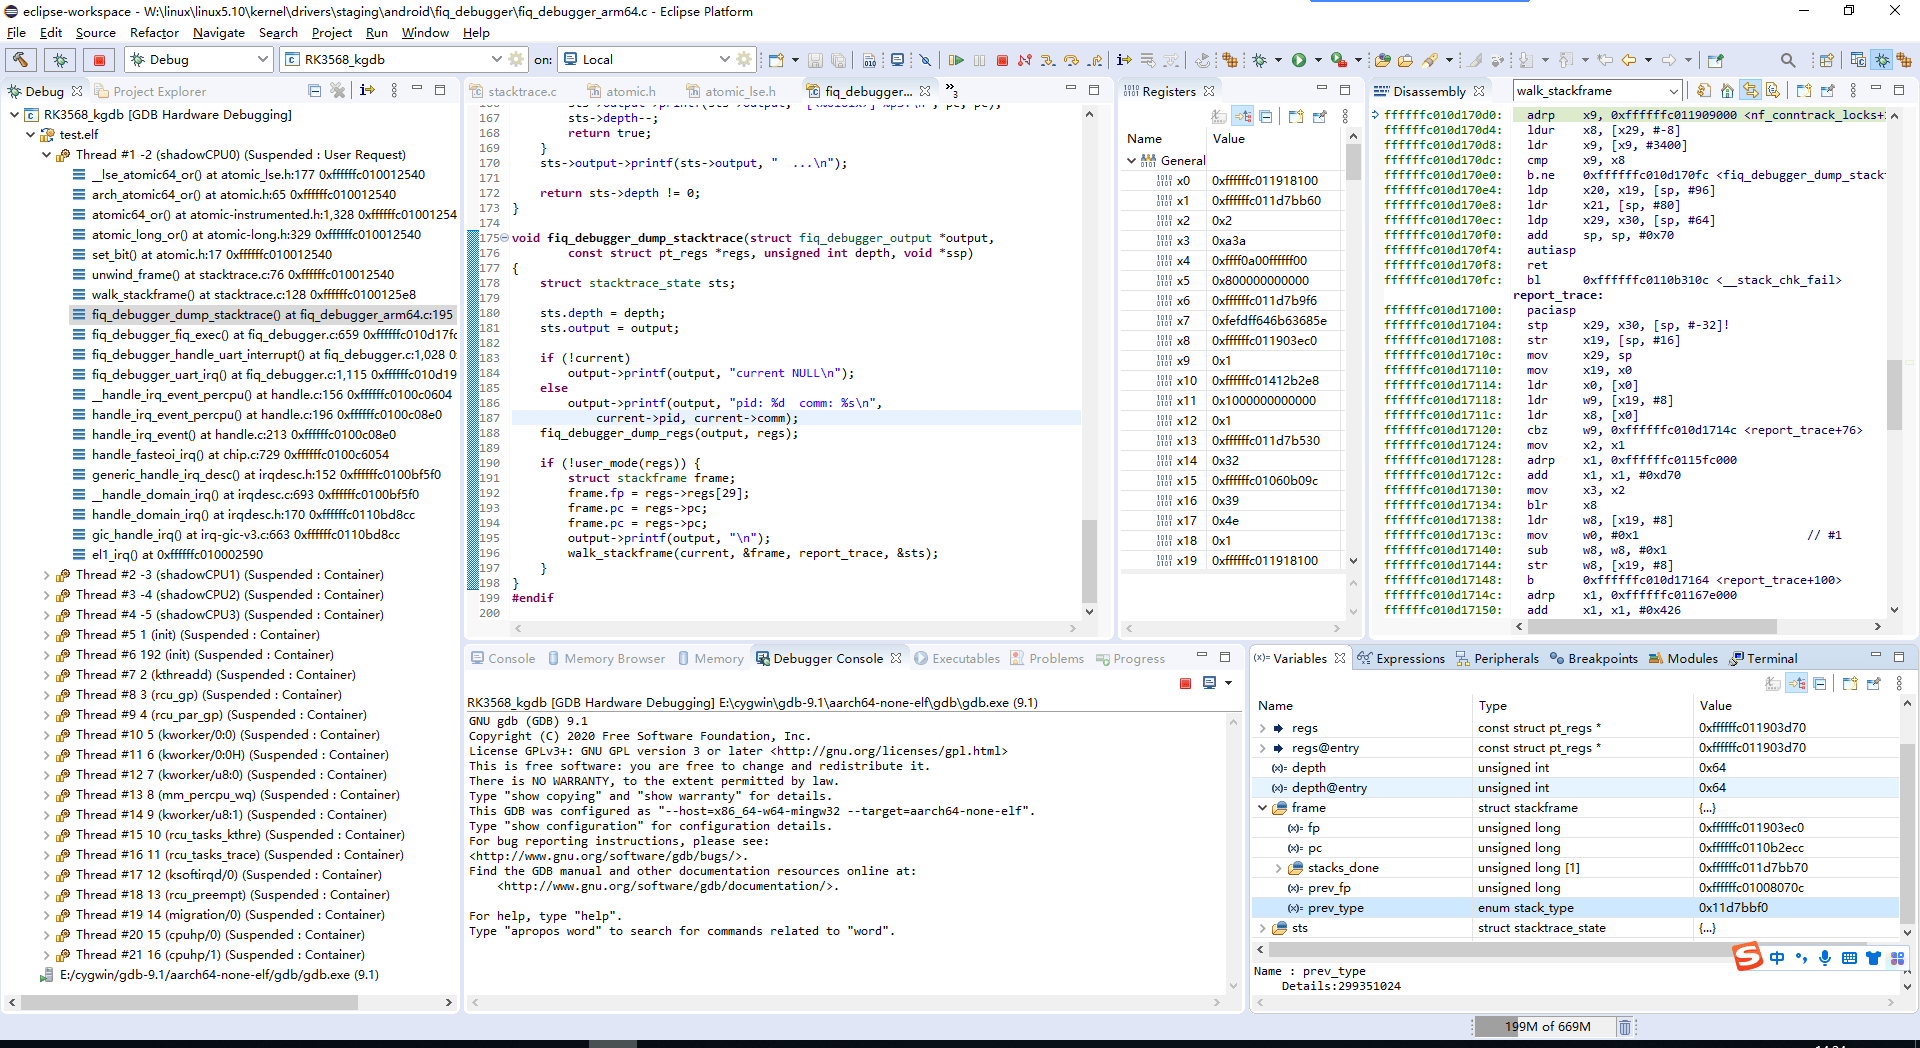
6.3 单步调试 Linux
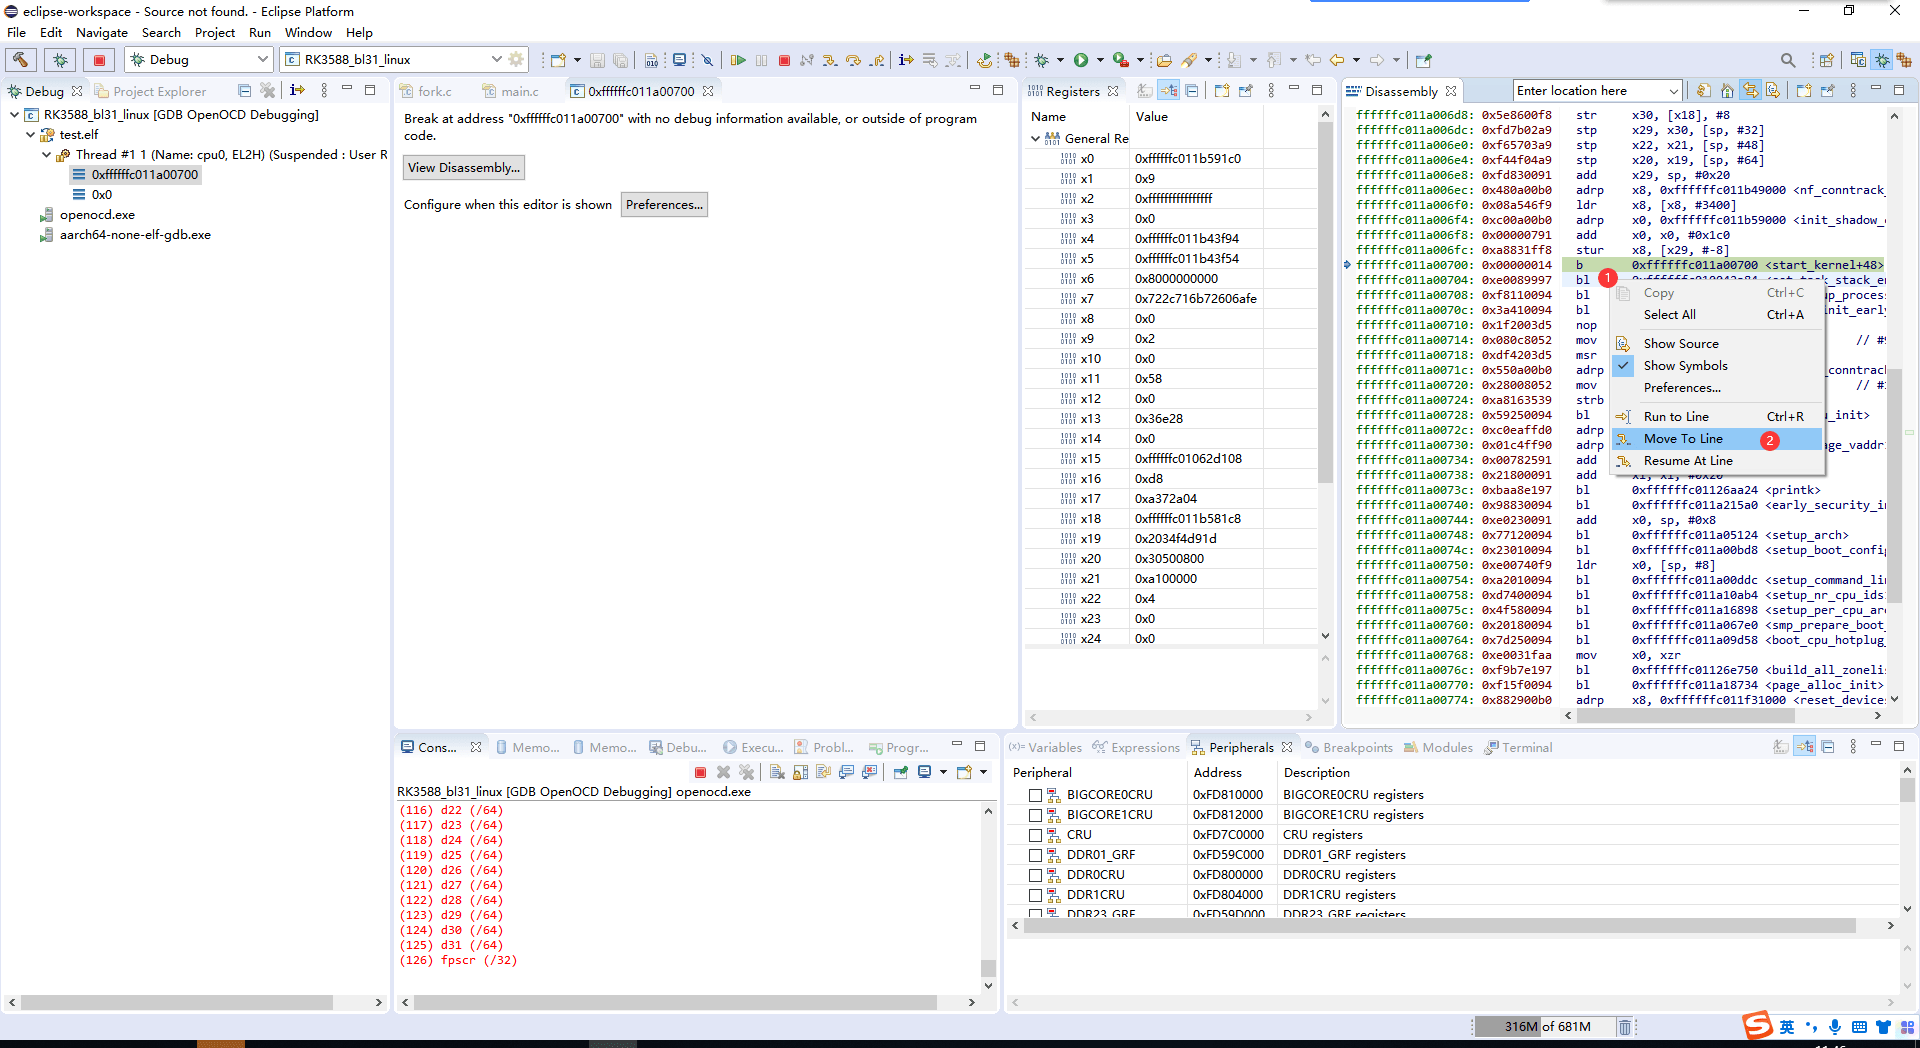
内核启动时完全没有日志,在排除串口问题后,可考虑内核早期启动异常。下面通过插入自循环暂停执行;这些示例会故意阻塞启动,不应留在生产镜像中。
6.3.1 内核单核阶段
修改 linux5.10/init/main.c。右击 b . 下一条指令,选择 Move To line 跳过自循环后单步。
 linux5.10/init/main.c
 asmlinkage __visible void __init __no_sanitize_address start_kernel(void)

 {
    char *command_line;
    char *after_dashes;
    asm volatile("b .");
  ...
  }
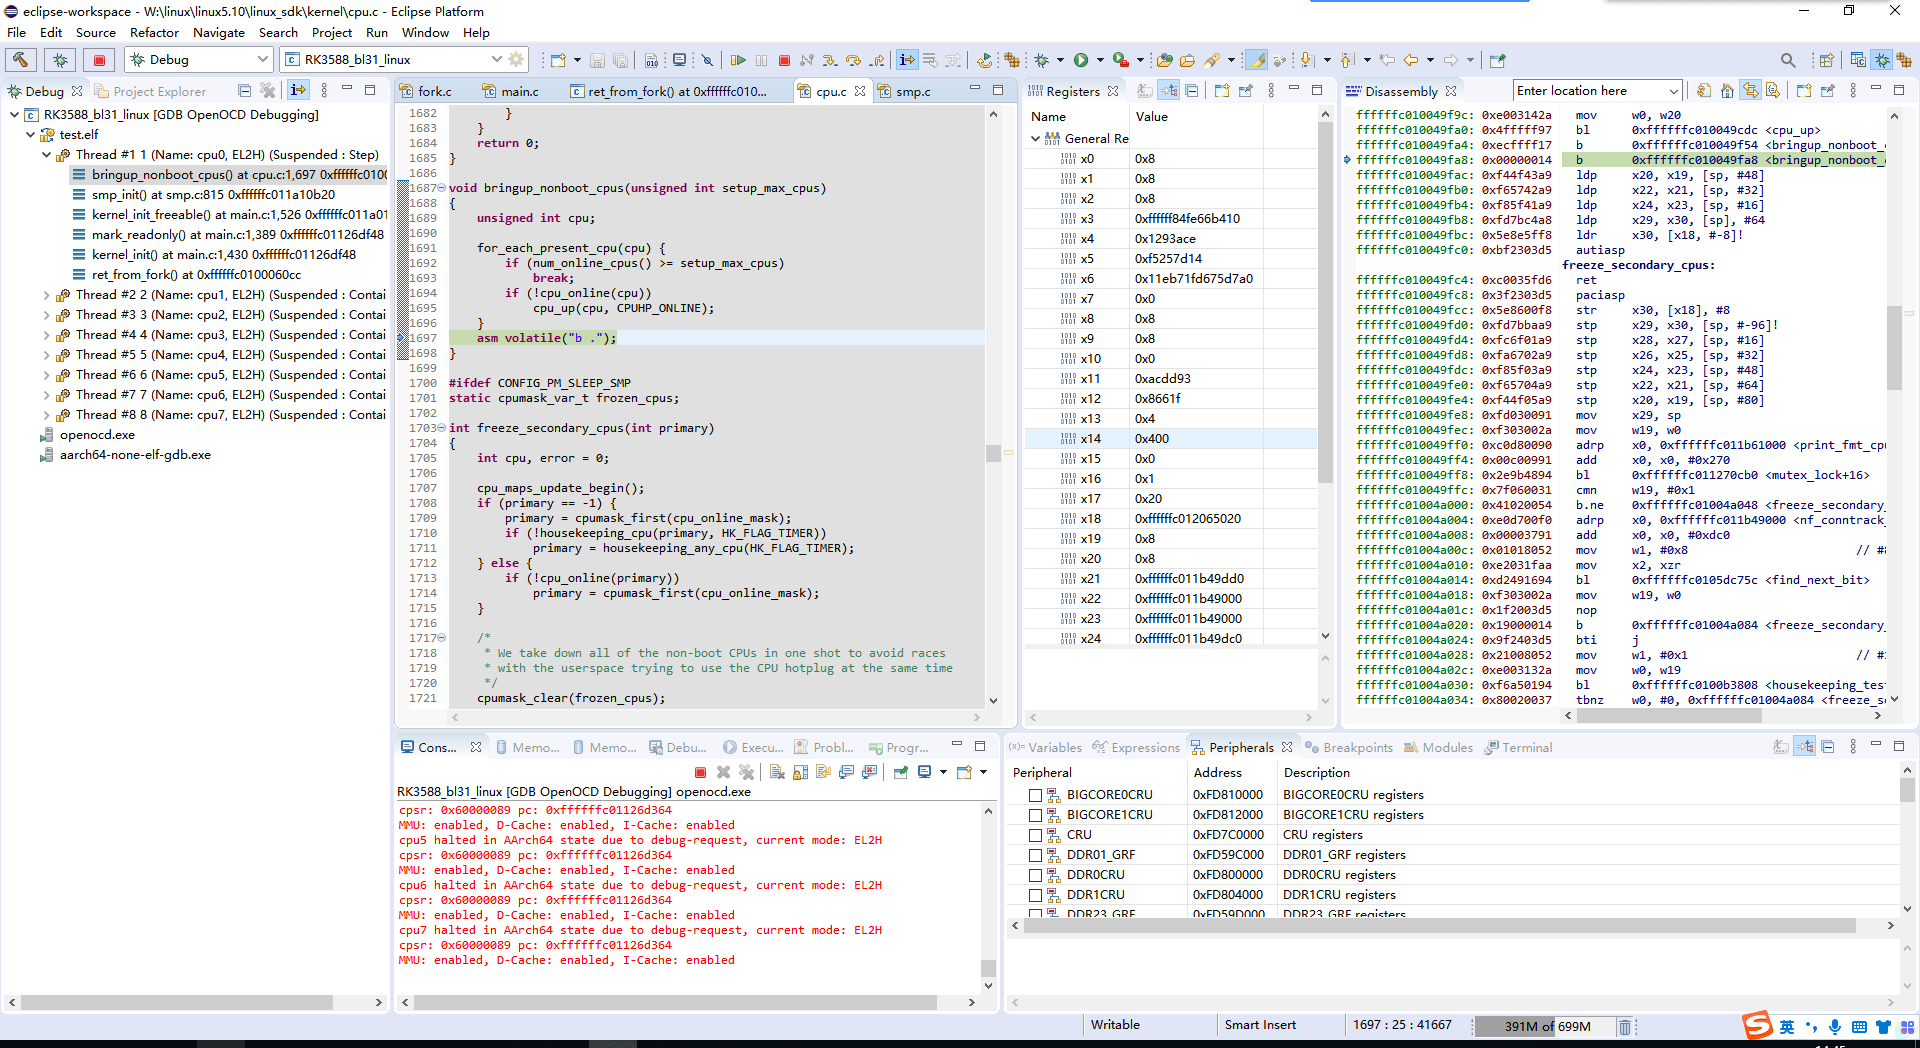
6.3.2 内核多核阶段
修改 linux5.10/kernel/cpu.c:
 linux5.10/kernel/cpu.c
 void bringup_nonboot_cpus(unsigned int setup_max_cpus)

 {
    unsigned int cpu;

    for_each_present_cpu(cpu) {
       if (num_online_cpus() >= setup_max_cpus)
          break;
       if (!cpu_online(cpu))
          cpu_up(cpu, CPUHP_ONLINE);
    }
    asm volatile("b .");
 }
6.4 裸机调试
6.4.1 创建工程
按 Eclipse 标准流程创建工程,配置编译器参数及交叉编译器。
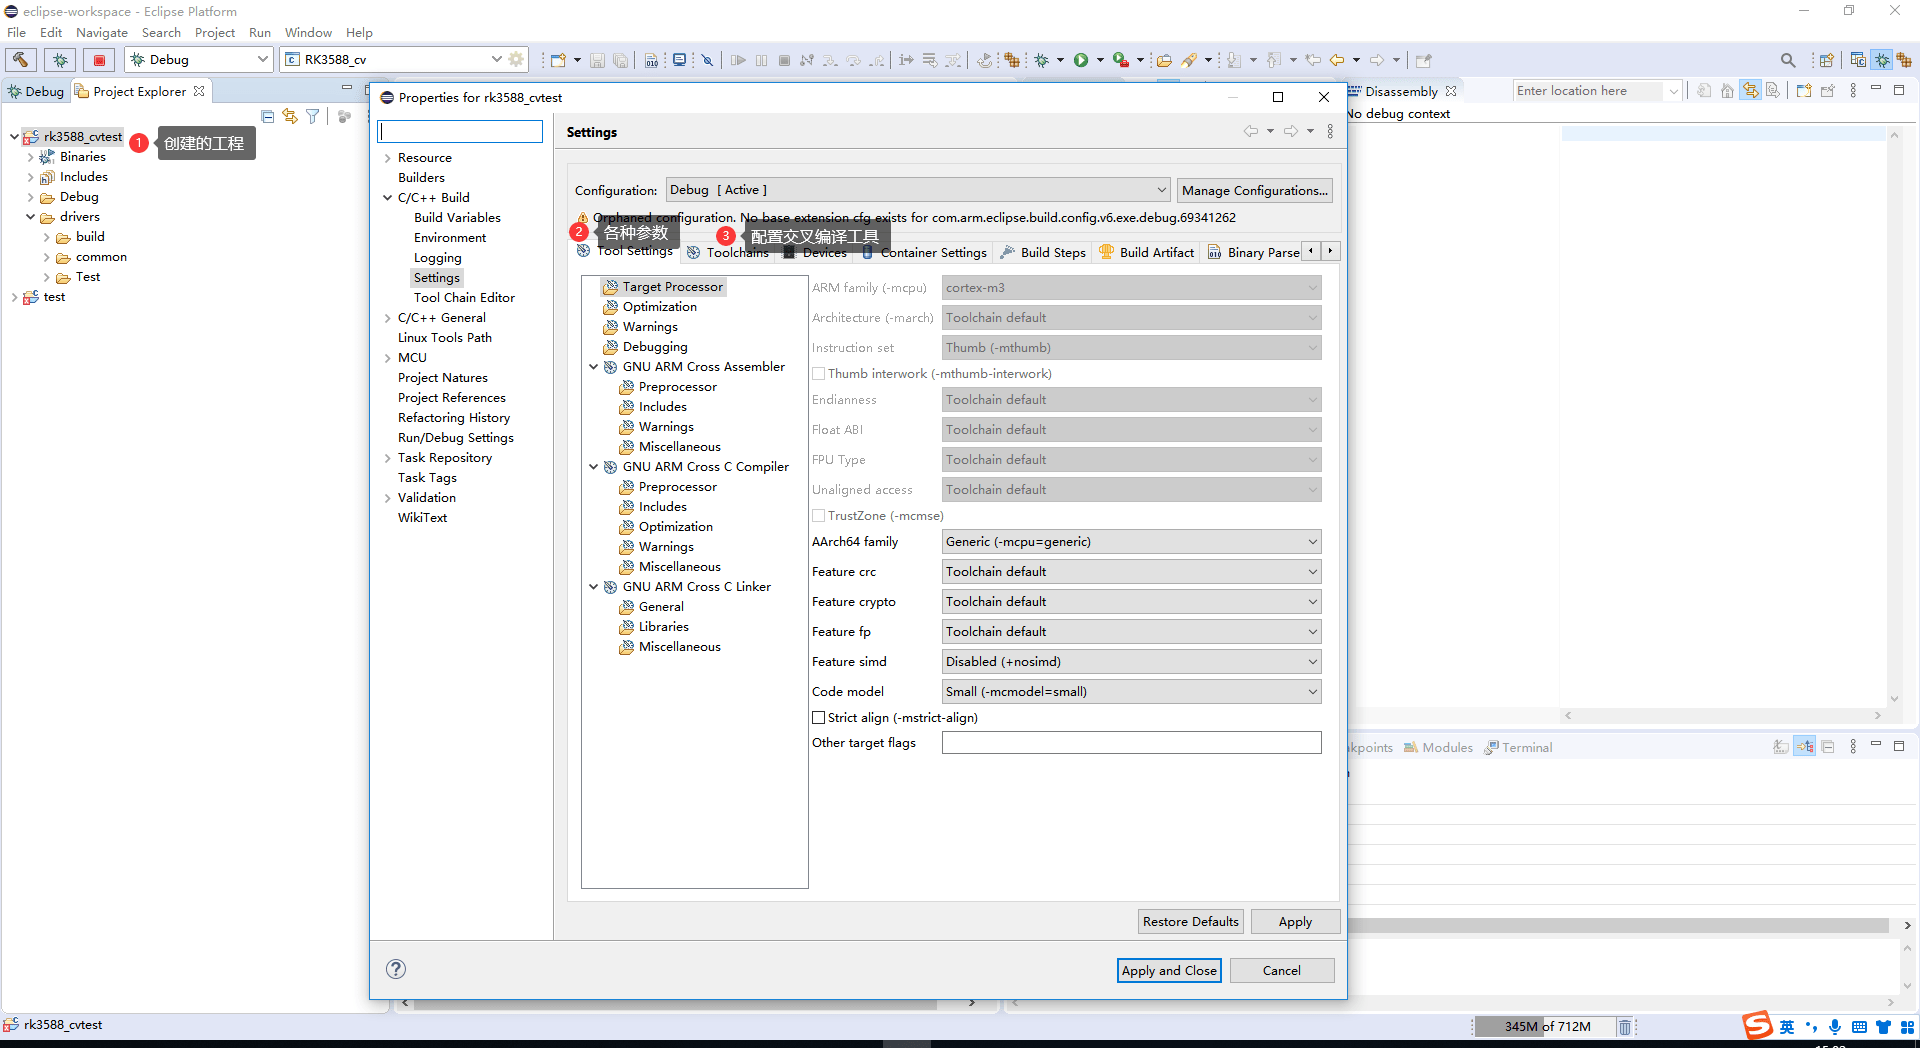
6.4.2 加载并运行固件
先复制目标芯片的配置,再在副本上修改调试设置。
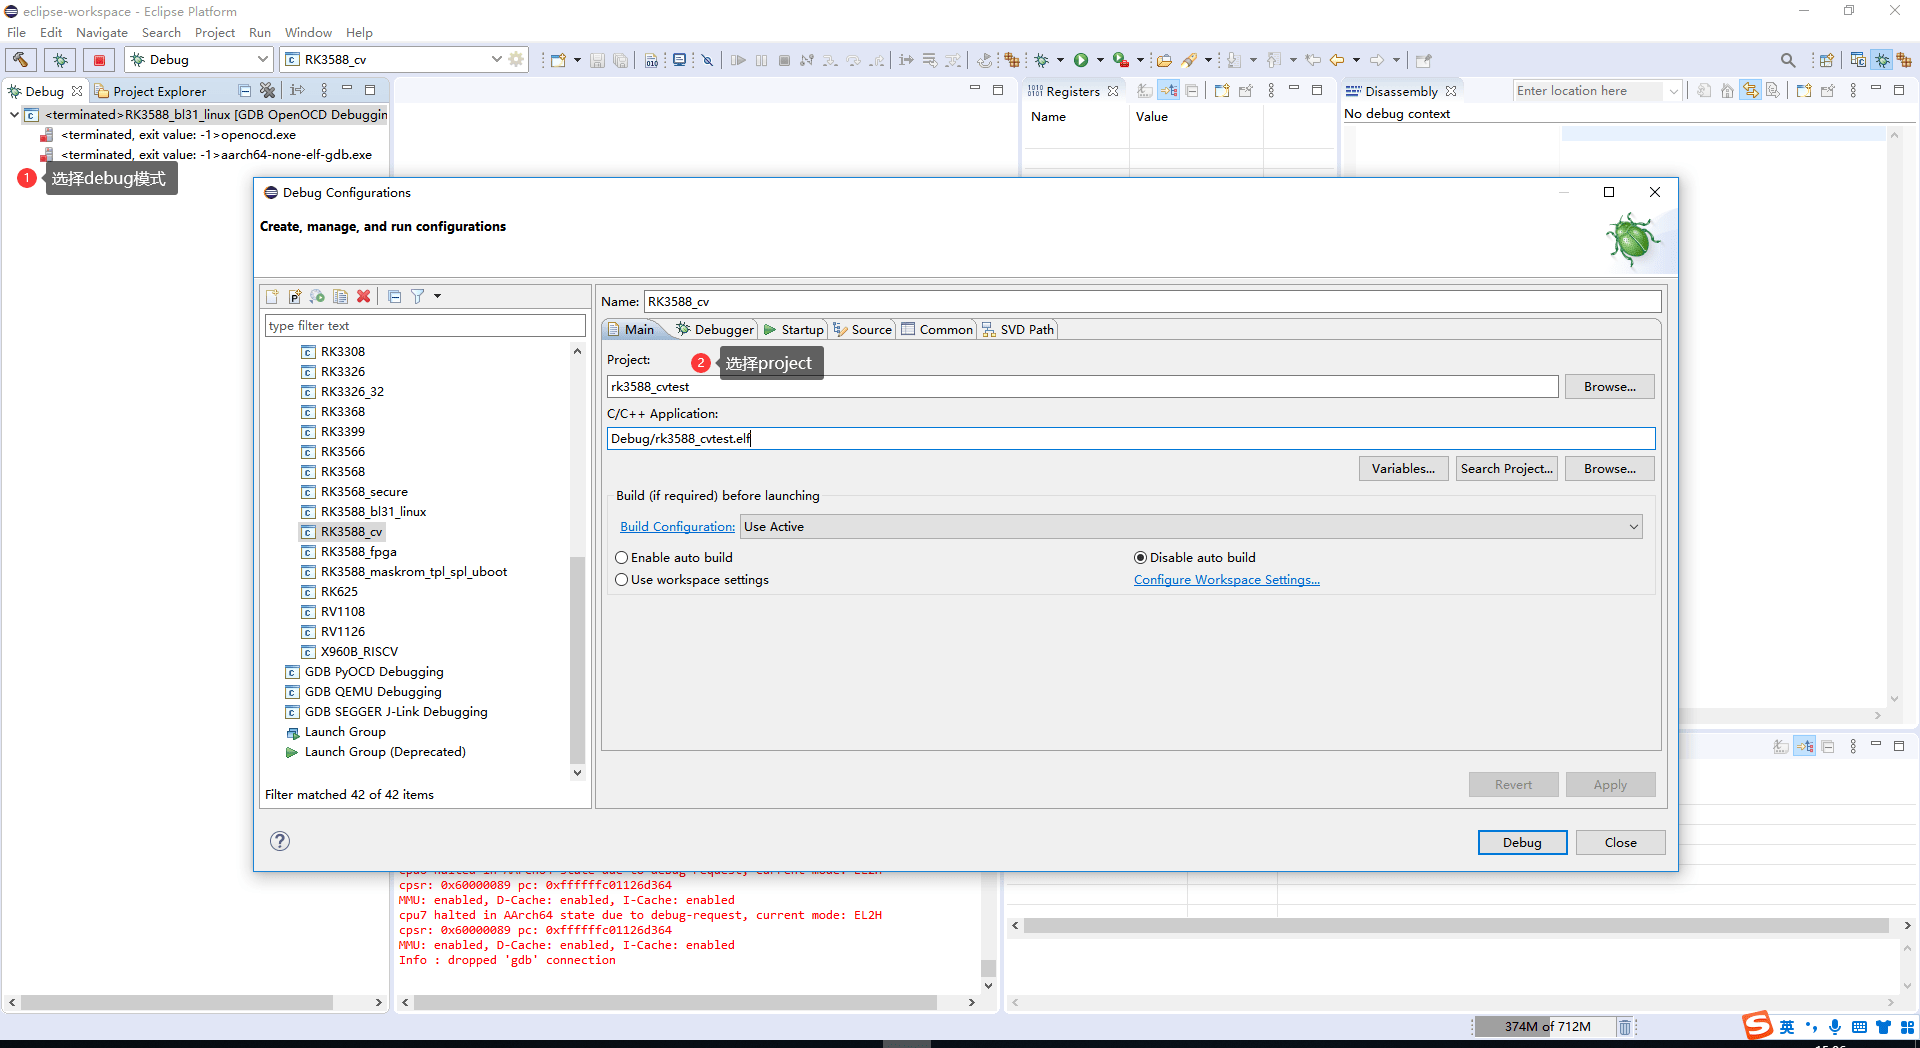
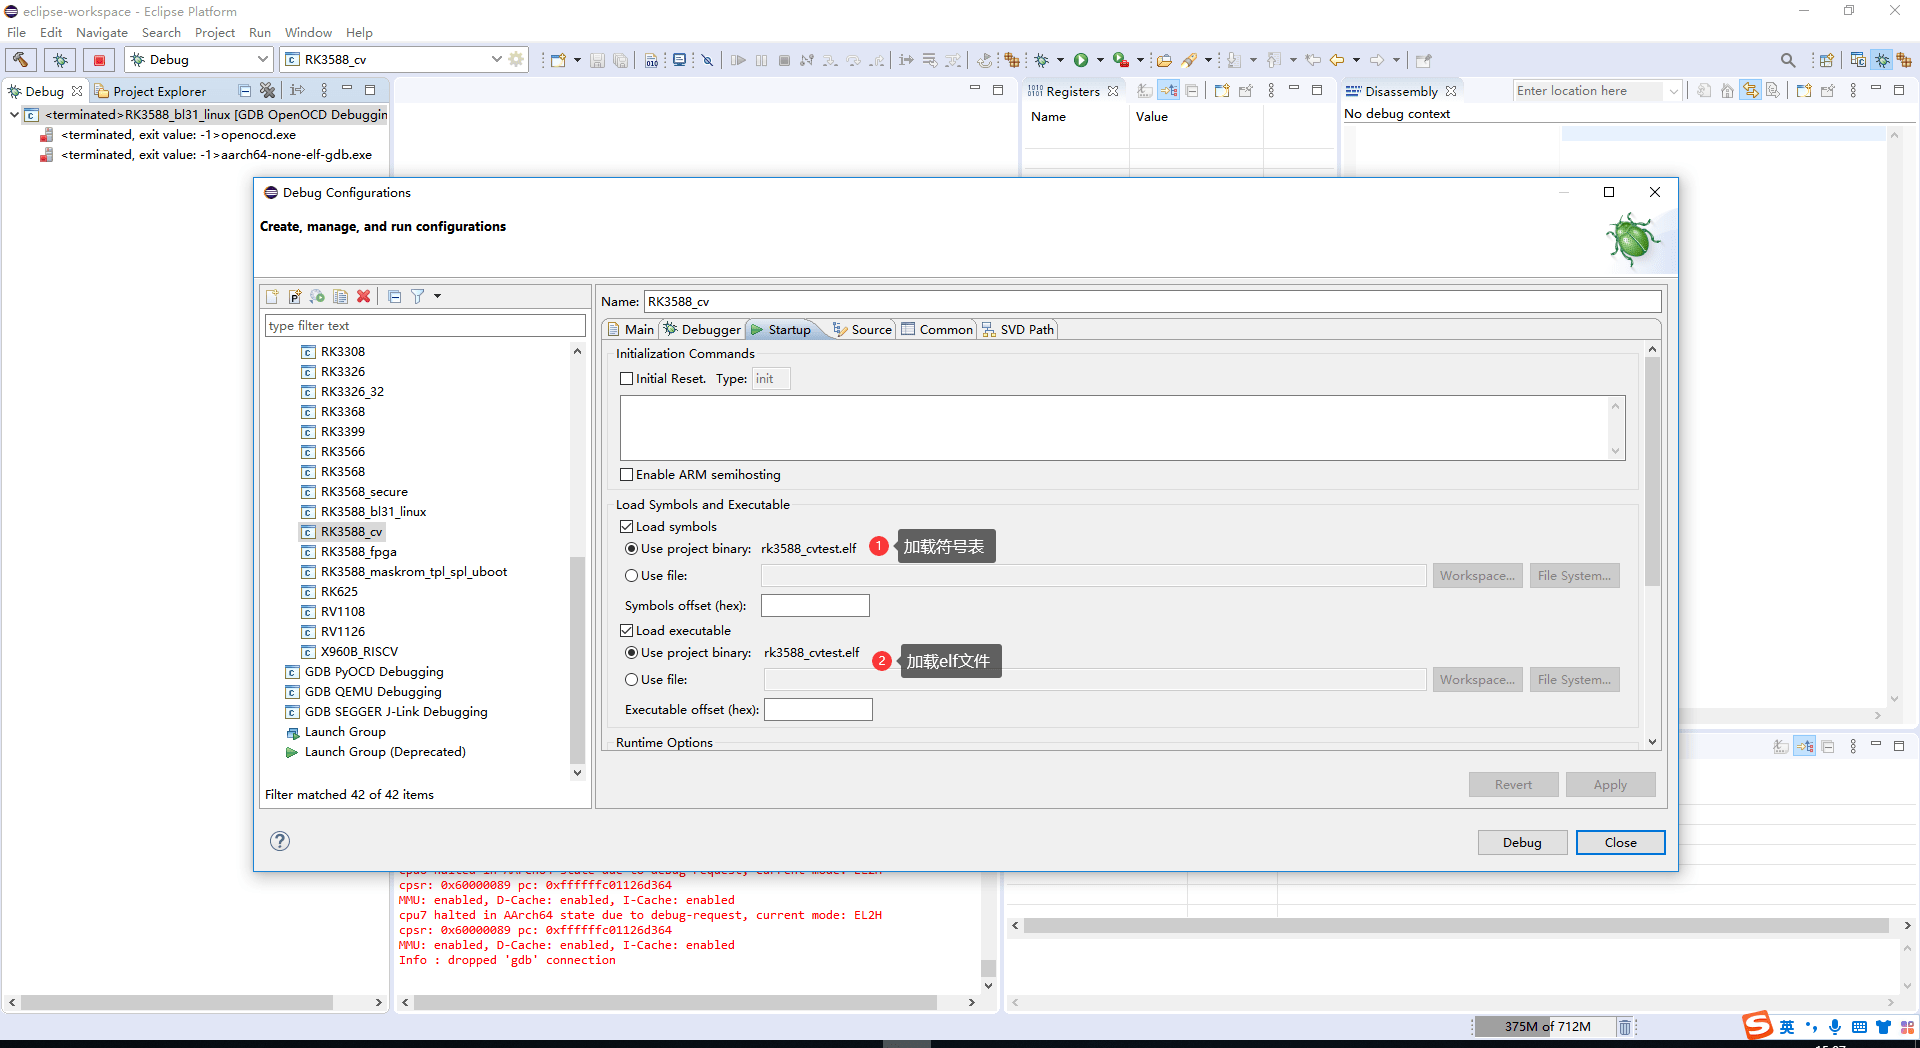
6.5 KGDB 使用
6.5.1 用途
用于驱动调试,以及非法指针发生时回溯完整调用栈、定位出错点;使用串口通信而不是 JTAG。
6.5.2 使能
按原文 menuconfig 配置。panic timeout 设为 0,使发生 die 时进入 KGDB 而不是自动重启;也可通过 echo 0 > /sys/module/kernel/parameters/panic 设置。
 Device Drivers --->
   Character devices --->
     [*]  Virtual terminal

         [*]   Enable character translations in console (NEW)
         [*]   Support for console on virtual terminal (NEW)
 -> Kernel hacking
  -> Generic Kernel Debugging Instruments
    [*] KGDB: kernel debugger --->
     --- KGDB: kernel debugger
     [*]  KGDB: use kprobe blocklist to prohibit unsafe breakpoints (NEW)
     <*>  KGDB: use kgdb over the serial console (NEW)

 Kernel hacking --->
   Debug Oops, Lockups and Hangs --->
    (0) panic timeout 这个要配成0,出现die时才会进⼊kgdb

  或者echo 0 > /sys/module/kernel/parameters/panic 将panic timeout时间设为0,即
 不reboot
内核配置示例位于 arch/arm64/boot/dts/rockchip/rk3588-android.dtsi:
 arch/arm64/boot/dts/rockchip/rk3588-android.dtsi
 chosen {
    bootargs = "kgdboc_earlycon kgdboc=ttyFIQ0,1500000";

 };
原文通过 echo g > /proc/sysrq-trigger 验证,日志最终显示等待远程调试器:
 echo g > /proc/sysrq-trigger

 [  1.385017][ T0] kgdboc: No suitable earlycon yet, will try later

 [  1.385069][ T0] earlycon: uart8250 at MMIO32 0x00000000feb50000
 (options '')
 [  1.390726][ T0] printk: bootconsole [uart8250] enabled
 [  2.956193][ T0] kgdboc: Going to register kgdb with earlycon 'uart'
 [  2.956196][ T0] KGDB: Registered I/O driver kgdboc_earlycon
 [  3.092139][ T1] Unable to handle kernel NULL pointer dereference at
 virtual address 000000000000007f
 [  3.093010][ T1] Mem abort info:
 [  3.093329][ T1] ESR = 0x96000005
 [  3.093672][ T1] EC = 0x25: DABT (current EL), IL = 32 bits
 [  3.094219][ T1] SET = 0, FnV = 0
 [  3.094561][ T1] EA = 0, S1PTW = 0
 [  3.094912][ T1] Data abort info:

 [  3.095238][ T1] ISV = 0, ISS = 0x00000005
 [  3.095651][ T1] CM = 0, WnR = 0
 [  3.095987][ T1] [000000000000007f] user address but active_mm is
 swapper
 [  3.096633][ T1] Internal error: Oops: 96000005 [#1] PREEMPT SMP
 [  3.097206][ T1] KGDB: Waiting for remote debugger
6.5.3 KGDB 配置
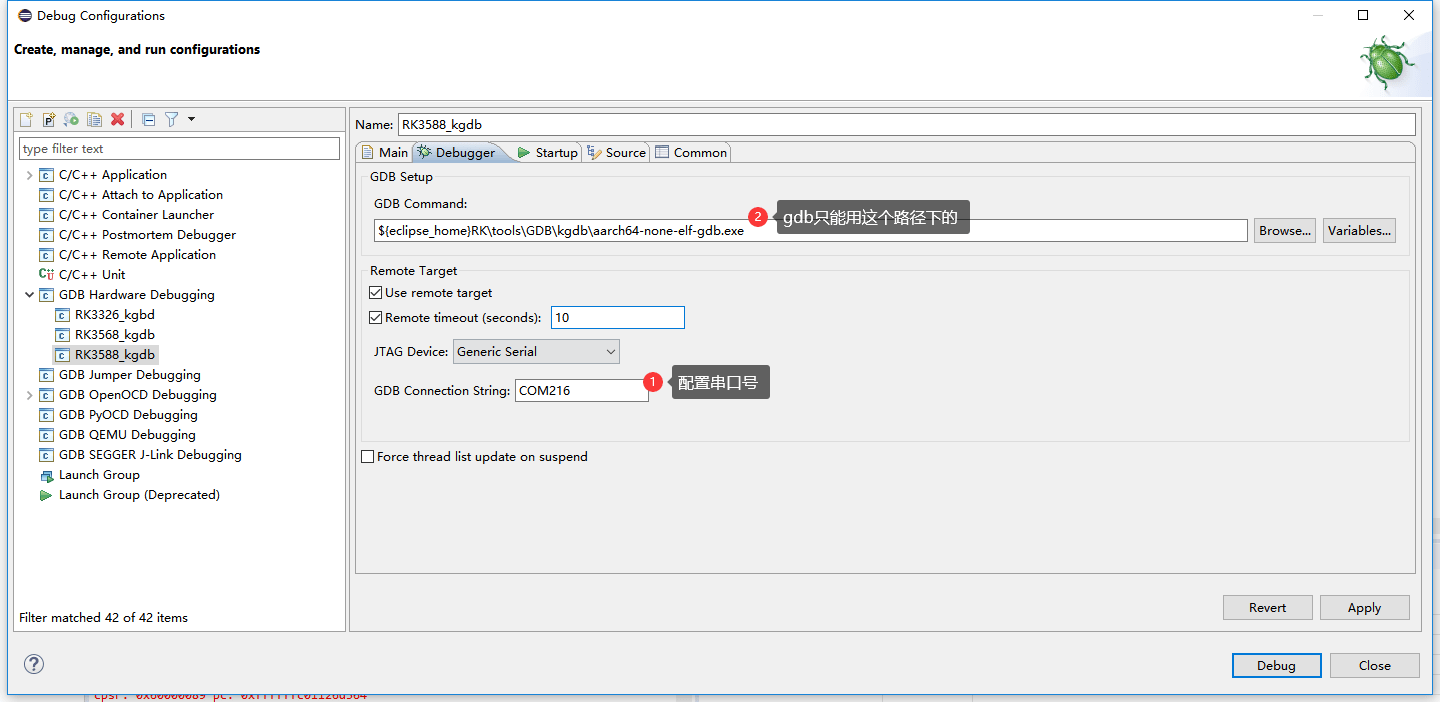
6.6 AArch64 的 32 位模式调试
-c "cpu0 aarch64_32 "
校对与环境限制
源文封面版本时间与部分日志时间不一致,芯片列表也不能用于推导软件版本。-r、cpu_block、fhalt、core_reg64、aarch64_32 等可能依赖 Rockchip 定制 OpenOCD,不保证上游版本具有相同命令。JRE 8、旧 Ubuntu/PPA 和各路径保留为历史原例,不宣称在当前环境可直接安装。所有原图已保留;图中额外的 UI 参数是对应旧软件配置。源日志中的许可证、必要署名和原有注释未按封面声明删除。完整校对记录。