
ArmSoM platform reference. Source RK-SM-YF-385 V1.0.1 describes power testing, initial diagnosis and optimization for RK3399 with Buildroot / Debian 9, aiming to balance system performance, reasonable power consumption and safety. No kernel or exact SDK/BSP version or validated ArmSoM board is specified. Check the actual board schematic, supply, display, drivers and SDK before use. Measurements below are manufacturer examples, not ArmSoM tests; no hardware validation was performed.
Only the Chinese source is available. English, Russian and German are full translations; all three figures use Chinese originals, not purported English figures. The two raster tables are also restored as editable tables. Source support matrix:
| Chip | Buildroot | Debian 9 |
|---|---|---|
| RK3399 | Y | Y |
1. Power consumption by system scenario
RK3399 test conditions: CPU 4xA53+2xA72 at up to 1.8GHz; DDR up to 856MHz; GPU up to 800MHz. The following covers static desktop, video playback, stress testing and deep sleep under Buildroot / Debian 9 Linux.
1.1 Buildroot scenario measurements

Buildroot source measurement table (Chinese original)
RK_IND_EVB_RK3399_LP4D200P232SD8_V11_20190905 · Sample:41810 · 693 Sample/S · 00:01:00
| Test scenario | VCC_SOC (mW) | VCC12V_DCIN (V) | VCC12V_DCIN (mA) | VDD_CPU_B (V) | VDD_CPU_B (mA) | VDD_GPU (V) | VDD_GPU (mA) | VDD_LOG (V) | VDD_LOG (mA) | VDD_CENTER (V) | VDD_CENTER (mA) | VDD_CPU_L (V) | VDD_CPU_L (mA) | VCC_DDR (V) | VCC_DDR (mA) | VCC3V3_SYS (V) | VCC3V3_SYS (mA) |
|---|---|---|---|---|---|---|---|---|---|---|---|---|---|---|---|---|---|
| Static desktop (display attached) | 1982.4726 | 11.932 | 907.6 | 0.856 | 16.5 | 0.862 | 60.5 | 0.96 | 276 | 0.924 | 531.7 | 0.832 | 18.5 | 1.088 | 58.1 | 3.26 | 331.7 |
| Static desktop (display removed) | 1876.9895 | 12.02 | 708.9 | 0.853 | 14.8 | 0.86 | 57.5 | 0.963 | 227.6 | 0.921 | 496.8 | 0.829 | 10.2 | 1.091 | 57.2 | 3.259 | 327.5 |
| 1080p Transformers 3 | 2340.035 | 11.89 | 997.5 | 0.857 | 20.7 | 0.862 | 187.4 | 0.959 | 297.1 | 0.929 | 739.1 | 0.841 | 54.3 | 1.08 | 58.8 | 3.261 | 331.2 |
| 4K@30fps Birds | 2392.5669 | 11.881 | 1019.6 | 0.858 | 20.5 | 0.863 | 137.6 | 0.959 | 304.9 | 0.932 | 815.8 | 0.845 | 68.4 | 1.078 | 58.8 | 3.26 | 332 |
| Glmark2 test | 2410.0431 | 11.887 | 1007.9 | 0.860 | 67.3 | 0.887 | 225.4 | 0.953 | 351 | 0.926 | 593.7 | 0.834 | 47.8 | 1.08 | 58.4 | 3.257 | 357.7 |
| Stress test | 4126.4532 | 11.736 | 1340 | 0.912 | 764.9 | 1.081 | 191.1 | 0.948 | 438.4 | 0.935 | 818.7 | 1.125 | 763.1 | 1.063 | 60.7 | 3.26 | 336.1 |
| Deep-sleep test | 120.5585 | 12.325 | 22.1 | 0 | 0 | 0 | 0 | 0.979 | 35.1 | 0 | 0 | 0 | 0 | 1.093 | 53.6 | 3.287 | 8.4 |
The source analysis gives the following values (original rounding retained; not recomputed from the table):
| Scenario | Symbol | Power |
|---|---|---|
| Display | Pd | 2.3W |
| Static-desktop total | Pui | 10.8W |
| 1080P video total | Pl | 11.86W |
| 4K@30fps video total | Pb | 12.1W |
| Glmark2 total | Pg | 11.98W |
| Stress-test total | Ps | 15.72W |
| Static-desktop SoC | Psui | 1.88W |
| 1080P video SoC | Psl | 2.34W |
| 4K video SoC | Psb | 2.39W |
| Glmark2 SoC | Psg | 2.41W |
| Stress-test SoC | Pss | 4.13W |
| Deep-sleep SoC | Ps2 | 120.5mW |
1.2 Debian 9 scenario measurements

Debian 9 source measurement table (Chinese original)
RK_IND_EVB_RK3399_LP4D200P232SD8_V11_20190905 · Sample:41810 · 693 Sample/S · 00:01:00
| Test scenario | VCC_SOC (mW) | VCC12V_DCIN (V) | VCC12V_DCIN (mA) | VDD_CPU_B (V) | VDD_CPU_B (mA) | VDD_GPU (V) | VDD_GPU (mA) | VDD_LOG (V) | VDD_LOG (mA) | VDD_CENTER (V) | VDD_CENTER (mA) | VDD_CPU_L (V) | VDD_CPU_L (mA) | VCC_DDR (V) | VCC_DDR (mA) | VCC3V3_SYS (V) | VCC3V3_SYS (mA) |
|---|---|---|---|---|---|---|---|---|---|---|---|---|---|---|---|---|---|
| Static desktop (display attached) | 1966.9842 | 11.927 | 909.3 | 0.856 | 15 | 0.866 | 52.3 | 0.961 | 270.7 | 0.924 | 525.7 | 0.833 | 14 | 1.088 | 59.2 | 3.261 | 333.3 |
| Static desktop (display removed) | 1894.8035 | 12.021 | 700.9 | 0.853 | 17 | 0.863 | 55.6 | 0.963 | 228.7 | 0.921 | 499.8 | 0.83 | 15.1 | 1.09 | 57.9 | 3.259 | 330.2 |
| 1080p Transformers 3 | 2231.3292 | 11.907 | 959.9 | 0.857 | 18.3 | 0.864 | 61.1 | 0.952 | 356.5 | 0.927 | 701.5 | 0.832 | 25.6 | 1.085 | 58.4 | 3.26 | 333.9 |
| 4K@30fps Birds | 2381.1659 | 11.887 | 1006.8 | 0.857 | 25.8 | 0.864 | 66 | 0.951 | 366.7 | 0.931 | 815.8 | 0.836 | 32.7 | 1.078 | 58.4 | 3.259 | 338.6 |
| Glmark2 test | 2342.1851 | 11.887 | 1006.8 | 0.866 | 84.7 | 0.954 | 231 | 0.953 | 351.2 | 0.926 | 591.4 | 0.833 | 19.6 | 1.083 | 58.7 | 3.26 | 333.2 |
| Stress test | 4057.176 | 11.729 | 1360 | 1.01 | 805.7 | 0.867 | 147.5 | 0.948 | 445.5 | 0.938 | 814.4 | 1.123 | 683.5 | 1.057 | 60 | 3.261 | 336.8 |
| Deep-sleep test | 111.6261 | 12.325 | 20.9 | 0 | 0 | 0 | 0 | 0.979 | 32.3 | 0 | 0 | 0 | 0 | 1.094 | 53.3 | 3.287 | 6.6 |
The source analysis gives the following values (original rounding retained; not recomputed from the table):
| Scenario | Symbol | Power |
|---|---|---|
| Display | Pd | 2.4W |
| Static-desktop total | Pui | 10.84W |
| 1080P video total | Pl | 11.43W |
| 4K@30fps video total | Pb | 11.96W |
| Glmark2 total | Pg | 11.97W |
| Stress-test total | Ps | 15.95W |
| Static-desktop SoC | Psui | 1.89W |
| 1080P video SoC | Psl | 2.23W |
| 4K video SoC | Psb | 2.38W |
| Glmark2 SoC | Psg | 2.34W |
| Stress-test SoC | Pss | 4.06W |
| Deep-sleep SoC | Ps2 | 111.6mW |
2. System power optimization
2.1 Initial diagnostic steps
2.1.1 Compare total power
First compare total power for the same scenario to assess whether board consumption is normal, using the preceding data as a reference. If the customer board differs substantially from the Rockchip SDK board, break consumption down further. Apart from hardware differences, keep test conditions identical: for example, use the same 1080P/4K video source and remove the eDP screen and HDMI display.
2.1.2 Break down power by rail
Understand the project power tree. The figure shows the RK3399 Excavator board. Derive the tree from the schematic, insert a series resistor in each relevant circuit (the source generally recommends 20mR), and measure current. The source separates VCC3V3_SYS, VDD_CPU_B, VDD_CPU_L, VDD_GPU, VDD_LOG, VDD_0V9, VDD_CENTER, VCC_DDR and VCC_1V8. First compare big/little CPU, GPU and DDR consumption and frequency scaling. If voltage is raised, check whether the increment is an integer multiple of 12.5mv. When scaling policy is normal, compare other peripherals.
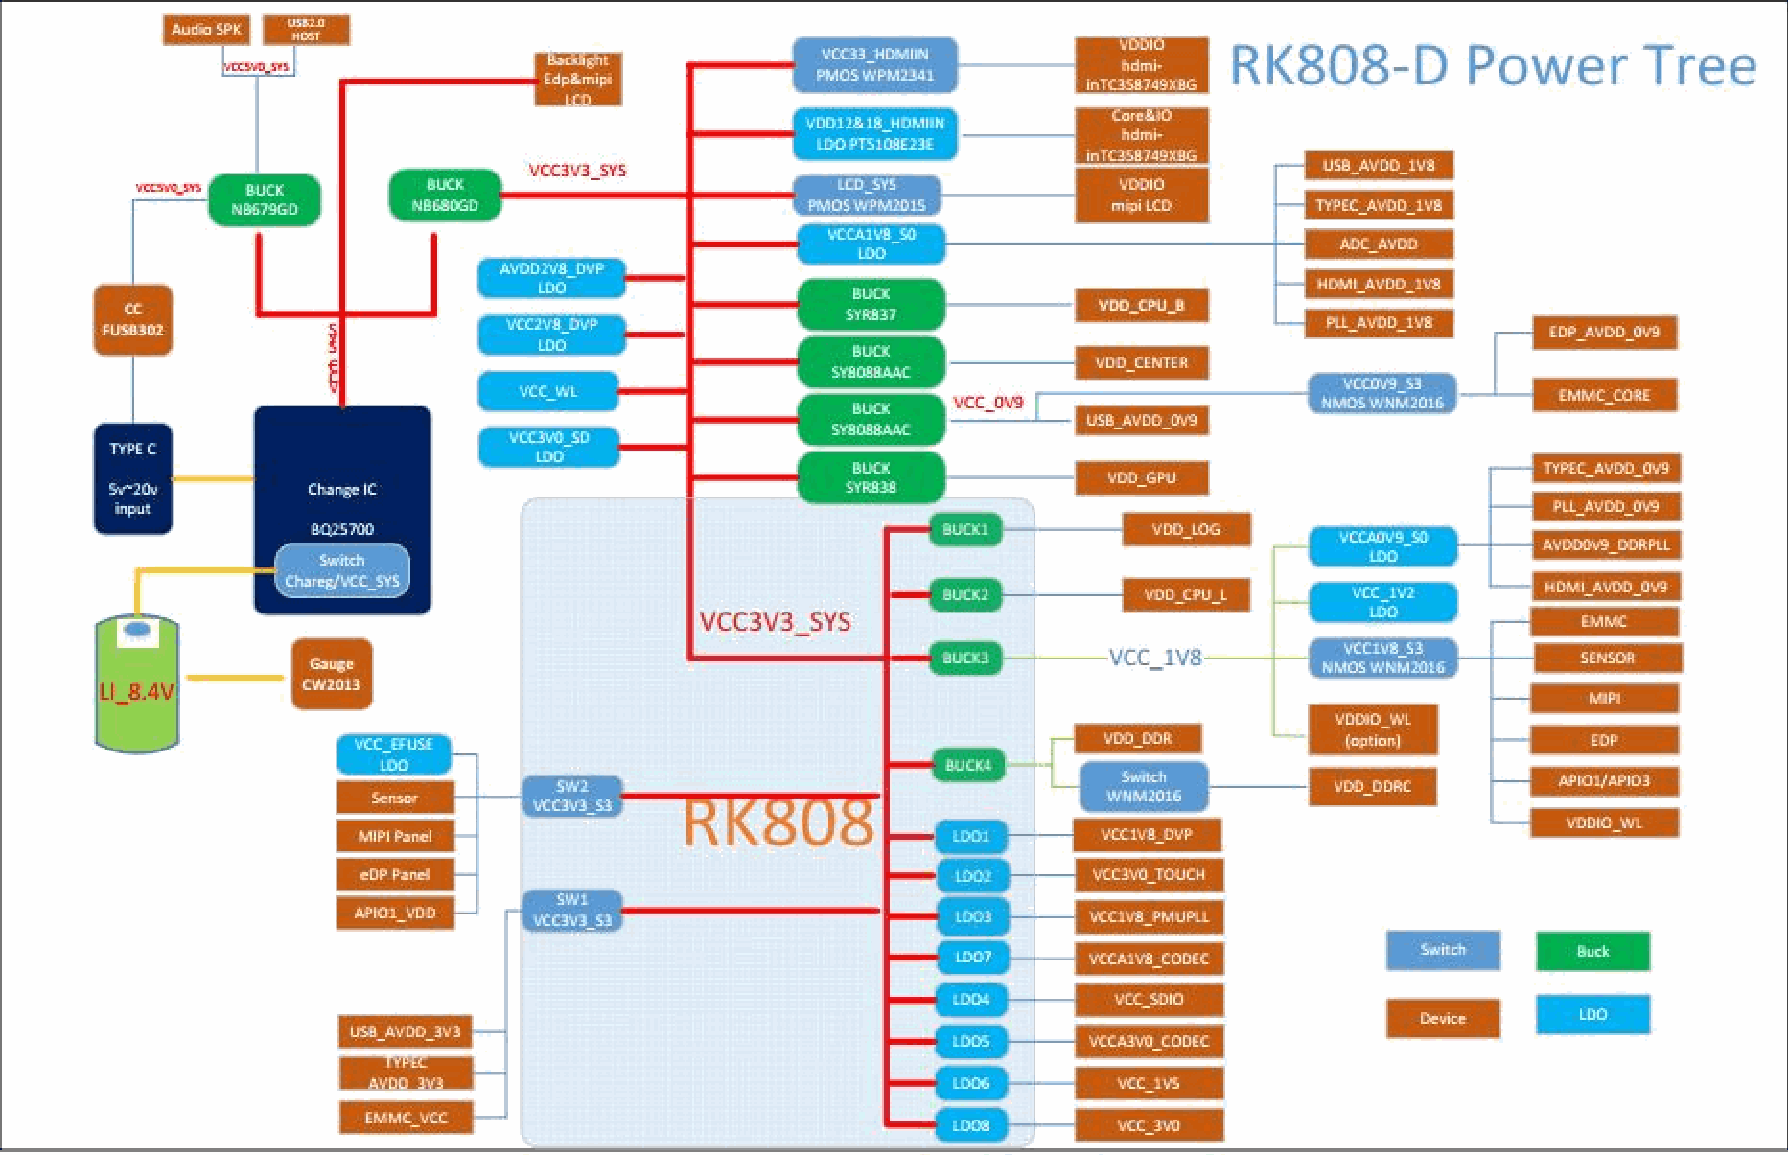
RK3399 Excavator power tree (Chinese source)
2.1.3 Check clocks
Inspect subsystem clock frequency, enable_count, prepare_count and parent/child relationships. The saradc examples below retain source comments:
# 获取总的Clock状态:
cat /sys/kernel/debug//clk/clk_summary
# 设置频率(单位 HZ):
echo 24000000 > /sys/kernel/debug/clk_saradc/clk_rate
# 获取频率:
cat /sys/kernel/debug/clk_saradc/clk_rate
# 打开 clock:
echo 1 > /sys/kernel/debug/clk_saradc/clk_enable_count
# 关闭 clock:
echo 0 > /sys/kernel/debug/clk_saradc/clk_enable_count
enable_count increases by 1 when a driver explicitly enables a clock with clk_enable. Some default always-on clocks may show either 1 or 0 and need not be the main focus. Check whether unused devices have CLK enable_cnt=0; if not, the source suggests manually disabling the clock for diagnosis. First ensure active hardware will not be affected.
2.1.4 Check power domains (PD)
Check every PD state. Unused modules should be suspended; a PD turns off only after all its devices suspend. The original output continues across the page boundary below:
# cat /sys/kernel/debug/pm_genpd/pm_genpd_summary
domain status slaves
/device runtime status
----------------------------------------------------------------------
pd_vopl on
/devices/platform/ff8f3f00.iommu active
/devices/platform/ff8f0000.vop active
pd_vopb off
/devices/platform/ff903f00.iommu suspended
/devices/platform/ff900000.vop suspended
pd_vo on pd_vopb, pd_vopl
pd_tcpc1 on
/devices/platform/ff800000.phy active
pd_tcpc0 on
/devices/platform/ff7c0000.phy active
pd_isp1 on
/devices/platform/ff924000.iommu active
/devices/platform/ff920000.rkisp1 suspended
pd_isp0 on
/devices/platform/ff914000.iommu active
/devices/platform/ff910000.rkisp1 suspended
pd_hdcp on
/devices/platform/ff940000.hdmi active
DTS configuration, using vopb:
vopb: vop@ff900000 {
    power-domains = <&power RK3399_PD_VOPB>;
};
Without a PD reference in the DTS node, the framework considers the domain unused and disables it after boot. With a PD reference but no runtime operations in the vop driver, the device becomes unsupported and the PD stays on. With both the reference and driver runtime operations, the driver controls whether the PD is enabled. To reduce runtime consumption, inspect PD summary and the clock tree and switch off unused modules’ PD/CLK to avoid internal MOS transistor leakage.
2.2 Initial optimization steps
2.2.1 Change default backlight brightness
[root@rk3399:/]# cat /sys/class/backlight/backlight/brightness
200
The default range is 0–255; larger values are brighter. Set 100 initially and reduce further as the application allows.
echo 100 > /sys/class/backlight/backlight/brightness
2.2.2 Reduce refresh rate
If the actual GPU frame rate stays below 30fps in the intended scenario, adjust the DSI refresh rate. This is the source partial diff; the source omits the end of the node, so it is not a standalone complete DTS.
native-mode= <&mipi_1280x800>;
mipi_1280x800: mipi-1280x800 {
-clock-frequency = <76000000>;
+ clock-frequency = <60000000>;//45fps
hactive = <800>;
vactive = <1280>;
hsync-len = <10>;
2.2.3 Disable the ISP
Disable unused modules in DTS. For a USB camera, the source suggests disabling ISP:
+&isp0{
+    status = "disabled";
+};
+
+&isp1 {
+    status = "disabled";
+};
+
+&isp0_mmu {
+    status = "disabled";
+};
+
+&isp1_mmu {
+    status = "disabled";
+};
2.2.4 Change the frequency-scaling policy
--- a/arch/arm64/boot/dts/rockchip/rk3399-opp.dtsi
+++ b/arch/arm64/boot/dts/rockchip/rk3399-opp.dtsi
@@ -50,6 +50,8 @@
rockchip,temp-hysteresis = <5000>;
rockchip,low-temp = <10000>;
rockchip,low-temp-min-volt = <900000>;
+ rockchip,high-temp = <45000>;
+ rockchip,high-temp-max-volt = <1000000>;
nvmem-cells = <&cpul_leakage>, <&specification_serial_number>;
nvmem-cell-names = "cpu_leakage",
@@ -141,6 +143,8 @@
rockchip,temp-hysteresis = <5000>;
rockchip,low-temp = <10000>;
rockchip,low-temp-min-volt = <900000>;
+ rockchip,high-temp = <45000>;
+ rockchip,high-temp-max-volt = <1025000>;
nvmem-cells = <&cpub_leakage>, <&specification_serial_number>;
nvmem-cell-names = "cpu_leakage",
2.2.5 Adjust target load
The default load is 90. Only the PDF line break within the cat command has been joined:
[root@rk3399:/sys/devices/system/cpu/cpufreq/policy4/interactive]# cat target_loads
90
The source proposes the following values. Its example still shows cat output and gives no write command; do not mistake cat for a setting operation:
[root@rk3399:/sys/devices/system/cpu/cpufreq/policy4/interactive]# cat target_loads
65 1008000:70 1200000:75 1416000:80 1608000:90
Editorial and adaptation notes
Source spellings 20mR and 12.5mv are retained; they normally denote milliohms and millivolts, but check the schematic and PMIC. The doubled slash in /sys/kernel/debug//clk/clk_summary and original clk_saradc paths are retained; verify against actual kernel debugfs. SoC power, board input power and display-removal conditions are distinct; do not mix them. Narrative rounding was not rewritten from table values. Section 2.2.4 temperature/voltage settings are not universally safe values for every SDK.
Official references: Rockchip; ArmSoM documentation.