
Complete technical translation of Chinese RK-SM-YF-488 V1.0.1, including every appendix. The source addresses Linux performance analysis across chips but does not establish compatibility with a particular ArmSoM board, a common SDK/BSP or kernel version; this is a platform reference. Check Ftrace, debugfs/tracefs, available events and permissions in the actual kernel, and match the DMC patch to the BSP. The RK3399 Android 11 prompts are source examples, not ArmSoM measurements. Only the Chinese PDF is available; all four languages use its original figures. No hardware validation was performed.
Editorial note: the DMC example jumps from
total_time == 0to a path that still divides bytotal_time, and calculates load using integer division before multiplication by 100. Both are retained; assess division-by-zero and precision risks before use. The appendix leaves//#define TRACE_ONdisabled, producing empty functions unless enabled. File-open/write failures and thread synchronisation are not fully handled; this is not a validated production library. PDF soft wraps were repaired without changing these algorithms or constants. The Chrome interface follows the source; current software versions require separate verification.
ArmSoM Docs · Rockchip Linux kernel · Catapult
1. Enable Kernel Tracer and Debug FS
Before starting the analysis, ensure that Tracer and Debug FS are enabled in the kernel. Check with the following commands:
rk3399_Android11:/data/local/tmp # mount | grep debugfs
/sys/kernel/debug on /sys/kernel/debug type debugfs (rw,seclabel,relatime,mode=755)
1|rk3399_Android11:/data/local/tmp # mount | grep trace
tracefs on /sys/kernel/tracing type tracefs (rw,seclabel,relatime,mode=755)
tracefs on /sys/kernel/debug/tracing type tracefs (rw,seclabel,relatime,mode=755)
If these nodes are absent, enable the following options with make menuconfig, then flash the replacement kernel:
CONFIG_FTRACE
CONFIG_ENABLE_DEFAULT_TRACERS
CONFIG_DEBUG_FS
2. Download Catapult
For graphical analysis, download Chrome’s Catapult performance analysis tools:
git clone https://github.com/catapult-project/catapult.git
3. Code instrumentation
Tracer relies on code instrumentation. Most important kernel execution points already have instrumentation points, called events in the kernel. List them with:
rk3399_Android11:/data/local/tmp # ls /sys/kernel/debug/tracing/events/
alarmtimer  cgroup               drm        fib6          header_page  jbd2
module          pagemap  raw_syscalls  rtc     sock        thermal_ipa_power
   vmscan
android_fs  clk                  dwc3       filelock      i2c          kmem
namei           percpu   rcu           sched   spi
thermal_power_allocator  workqueue
asoc        cma                  emulation  filemap       initcall     libata
napi            power    regmap        scmi    swiotlb     thermal_virtual
   writeback
binder      compaction           enable     ftrace        iommu        mac80211
net             printk   regulator     scsi    sync_trace  timer
   xdp
block       cpufreq_interactive  ext4       gadget        ion          mdio
nvme            qdisc    rogue         signal  task        udp
   xhci-hcd
bridge      cpuhp                f2fs       gpio          ipi          migrate
oom             random   rpm           skb     tcp         v4l2
cfg80211    dma_fence            fib        header_event  irq          mmc
page_isolation  ras      rseq          smbus   thermal     vb2
Enable events according to the analysis you need. For example, investigating a storage performance bottleneck usually requires filesystem, block-layer and device-layer events:
echo 1 > /sys/kernel/debug/tracing/events/ext4/enable      # 打开文件系统开关,假设你的文件系统是ext4
echo 1 > /sys/kernel/debug/tracing/events/block/enable     # 打开通用block层event开关
echo 1 > /sys/kernel/debug/tracing/events/mmc/enable       # 打开设备层event开关,假设你的存储介质是EMMC
3.1 Kernel-space instrumentation
If the existing kernel events do not meet your needs, define your own. For example, debugging DMC frequency changes requires two additional events, ddr_frequency and ddr_load. Add them as follows:
- Declare the new events. All kernel events must be declared under
include/trace/events/. Each header in that directory corresponds to an event directory in tracefs, for example:
ls include/trace/events/power.h -l
-rw-rw-r-- 1 cmc cmc 12129 2月  23  2022 include/trace/events/power.h      # 这是源码目录看到的头文件
ls /sys/kernel/debug/tracing/events/ -l | grep " power"
drwxr-xr-x  25 root root 0 1970-01-01 00:00 power                          # 这是设备的tracefs下看到event目录
To keep this example simple, add the new events directly to power.h:
diff --git a/include/trace/events/power.h b/include/trace/events/power.h
index f7aece721aed..29c962a862ce 100644
--- a/include/trace/events/power.h
+++ b/include/trace/events/power.h
@@ -529,6 +529,37 @@ DEFINE_EVENT(dev_pm_qos_request, dev_pm_qos_remove_request,

    TP_ARGS(name, type, new_value)
 );
+
+DECLARE_EVENT_CLASS(dram,
+
+   TP_PROTO(unsigned int state),
+
+   TP_ARGS(state),
+
+   TP_STRUCT__entry(
+       __field(    u32,        state       )
+   ),
+
+   TP_fast_assign(
+       __entry->state = state;
+   ),
+
+   TP_printk("state=%lu", (unsigned long)__entry->state)
+);
+
+DEFINE_EVENT(dram, ddr_frequency,                /* 这里定义了新的event:ddr_frequency,第二个参数就是event名,后面会用到 */
+
+   TP_PROTO(unsigned int state),
+
+   TP_ARGS(state)
+);
+
+DEFINE_EVENT(dram, ddr_load,                     /* 这里定义了新的event:ddr_load */
+
+   TP_PROTO(unsigned int state),
+
+   TP_ARGS(state)
+);
 #endif /* _TRACE_POWER_H */

 /* This part must be outside protection */
- Call the events at the appropriate points. Since we want to monitor DMC frequency changes, call them in the frequency-scaling function:
diff --git a/drivers/devfreq/rockchip_dmc.c b/drivers/devfreq/rockchip_dmc.c
index d75c21e51854..7c3971ccf397 100644
--- a/drivers/devfreq/rockchip_dmc.c
+++ b/drivers/devfreq/rockchip_dmc.c
@@ -52,6 +52,7 @@
 #include <soc/rockchip/rockchip_opp_select.h>
 #include <soc/rockchip/scpi.h>
 #include <uapi/drm/drm_mode.h>
+#include <trace/events/power.h>

 #include "governor.h"
 #include "rockchip_dmc_timing.h"
@@ -2636,7 +2637,7 @@ static int devfreq_dmc_ondemand_func(struct devfreq *df,
    /* Assume MAX if it is going to be divided by zero */
    if (stat->total_time == 0) {
        *freq = DEVFREQ_MAX_FREQ;
-       return 0;
+       goto set_new_freq;
    }

    /* Prevent overflow */
@@ -2649,20 +2650,20 @@ static int devfreq_dmc_ondemand_func(struct devfreq *df,
    if (stat->busy_time * 100 >
        stat->total_time * upthreshold) {
        *freq = DEVFREQ_MAX_FREQ;
-       return 0;
+       goto set_new_freq;
    }

    /* Set MAX if we do not know the initial frequency */
    if (stat->current_frequency == 0) {
        *freq = DEVFREQ_MAX_FREQ;
-       return 0;
+       goto set_new_freq;
    }

    /* Keep the current frequency */
    if (stat->busy_time * 100 >
        stat->total_time * (upthreshold - downdifferential)) {
        *freq = max(target_freq, stat->current_frequency);
-       return 0;
+       goto set_new_freq;
    }

    /* Set the desired frequency based on the load */
@@ -2673,6 +2674,10 @@ static int devfreq_dmc_ondemand_func(struct devfreq *df,
    b = div_u64(b, (upthreshold - downdifferential / 2));
    *freq = max_t(unsigned long, target_freq, b);

+set_new_freq:
+   trace_ddr_frequency(*freq);               /* 引用我们加的两个新event,格式:trace_xxx, 其中xxx就是前面定义的event名 */
+   trace_ddr_load(div_u64(stat->busy_time, stat->total_time) * 100);
+
    return 0;

 reset_last_status:
- Enable the new events in the same way as the built-in events:
echo 1 > /sys/kernel/debug/tracing/events/power/ddr_frequency/enable      # 打开ddr_frequency开关
echo 1 > /sys/kernel/debug/tracing/events/power/ddr_load/enable     # 打开ddr_load开关
3.2 User-space instrumentation
User-space instrumentation uses an atrace library ported from Android. It also works through the trace_marker interface; its internal mechanism is not detailed here. The library provides C++ and C interfaces through atrace.h and trace.h, respectively, plus the implementation file trace.c. The files shown below can be copied from the appendix:
tar xvf atrace.tar.bz2
ls atrace
-rwx------ 1 cmc cmc  971 5月  14  2021 atrace.h              # 这是c++需要引用的头文件
-rwx------ 1 cmc cmc 2990 5月  14  2021 trace.c               # 这是库的源码,需要加到你的工程里编译
-rwx------ 1 cmc cmc  540 5月  14  2021 trace.h               # 这是c需要引用的头文件
The C++ example is simpler:
#include "atrace.h"

void ShaderCache::initShaderDiskCache() {
    ATRACE_NAME("iShaderDC");         // 最后在图形化分析的时候会看到iShaderDC的名字,就是对应这个函数的耗时
    std::lock_guard<std::mutex> lock(mMutex);

    // Emulators can switch between different renders either as part of config
    // or snapshot migration. Also, program binaries may not work well on some
    // desktop / laptop GPUs. Thus, disable the shader disk cache for emulator builds.
    if (!Properties::runningInEmulator && mFilename.length() > 0) {
        mBlobCache.reset(new FileBlobCache(maxKeySize, maxValueSize,
maxTotalSize, mFilename));
        mInitialized = true;
    }
}

camera_status_t ACameraDevice_close(ACameraDevice* device) {
    ATRACE_CALL();                // 自动以当前函数名命名,所以最后在图形化分析里会看到这个函数名
    if (device == nullptr) {
        ALOGE("%s: invalid argument! device is null", __FUNCTION__);
        return ACAMERA_ERROR_INVALID_PARAMETER;
    }
    delete device;
    return ACAMERA_OK;
}
For C function calls, mark the beginning and end explicitly:
#include "trace.h"

void fun2() {
  /* do something */
}

void fun1() {
  atrace_begin_body("fun1_call_fun2");
  /* call fun2 */
  fun2();
  atrace_end_body();    /* 这样写,统计到的是fun1调用fun2的总时间 */
}
If fun2 has many callers and you want to measure its cost, placing the instrumentation inside fun2 is more appropriate. Make sure that every return path calls atrace_end_body, for example:
#include "trace.h"

int fun2() {
  atrace_begin_body("fun2");

  if (cond1) {
    atrace_end_body();
    return err;
  }

  /* do something */
  atrace_end_body();
  return ok;
}
Note: remember to add trace.c to the build script.
4. Capture a raw trace
Raw traces are captured using the usual Linux method. For convenience, this is normally put into a script:
echo 4096 > /sys/kernel/debug/tracing/buffer_size_kb           # 设置buffer大小,太小的话,会导致event丢失,根据需要去调整
echo global > /sys/kernel/debug/tracing/trace_clock            # 启用全局时钟,确保每个核的时钟同步
echo 0 > /sys/kernel/debug/tracing/options/overwrite           # 不允许trace覆盖
echo 1 > /sys/kernel/debug/tracing/options/print-tgid          # 必须要打印线程id,这样图形化才不会混乱
echo 1 > /sys/kernel/debug/tracing/events/sched/sched_switch/enable # 下面是常用event的开关,通常都要开
echo 1 > /sys/kernel/debug/tracing/events/sched/sched_wakeup/enable
echo 1 > /sys/kernel/debug/tracing/events/sched/sched_waking/enable
echo 1 > /sys/kernel/debug/tracing/events/sched/sched_blocked_reason/enable
echo 1 > /sys/kernel/debug/tracing/events/irq/enable
echo 1 > /sys/kernel/debug/tracing/events/power/ddr_frequency/enable      # 根据自己的需要,去开启其他event
echo 1 > /sys/kernel/debug/tracing/events/power/ddr_load/enable
echo 1 > /sys/kernel/debug/tracing/tracing_on                             # 开始抓取
sleep $2                                                                  # 抓取的时间⻓度,通过参数传入
echo 0 > /sys/kernel/debug/tracing/tracing_on                             # 停止抓取
cat /sys/kernel/debug/tracing/trace > $1                                  # 保存trace到指定文件
Save the script above as atrace.sh, then capture a raw trace with:
atrace.sh /path/to/my_trace 2 # 即抓取2秒的trace,并保存到/path/to/my_trace
5. Generate HTML and analyse graphically
After capturing the raw trace, convert it to HTML with Catapult’s trace2html command:
cd catapult
./tracing/bin/trace2html --config chrome --output /path/to/my_trace.html /path/to/my_trace
ls -l /path/to/my_trace.html
-rw-r--r-- 1 cmc cmc   4712388 1月   7  2022 /path/to/my_trace.html
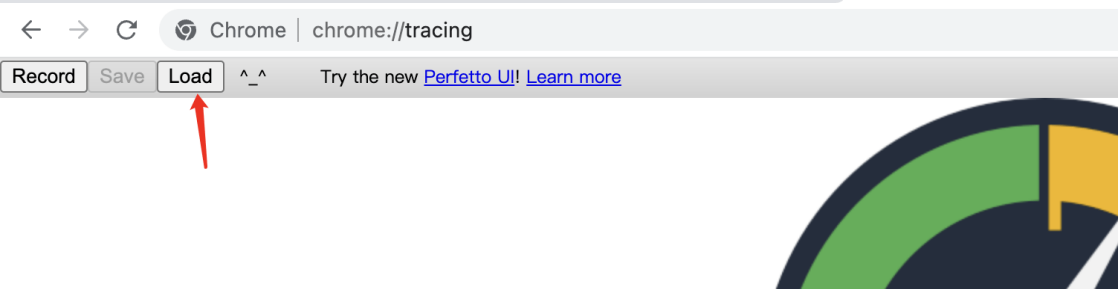
In the workflow described by the source, open Chrome and enter chrome://tracing/ in the address bar. The following interface should appear:
Click Load and choose the HTML file converted earlier to display the standard Android Systrace interface:
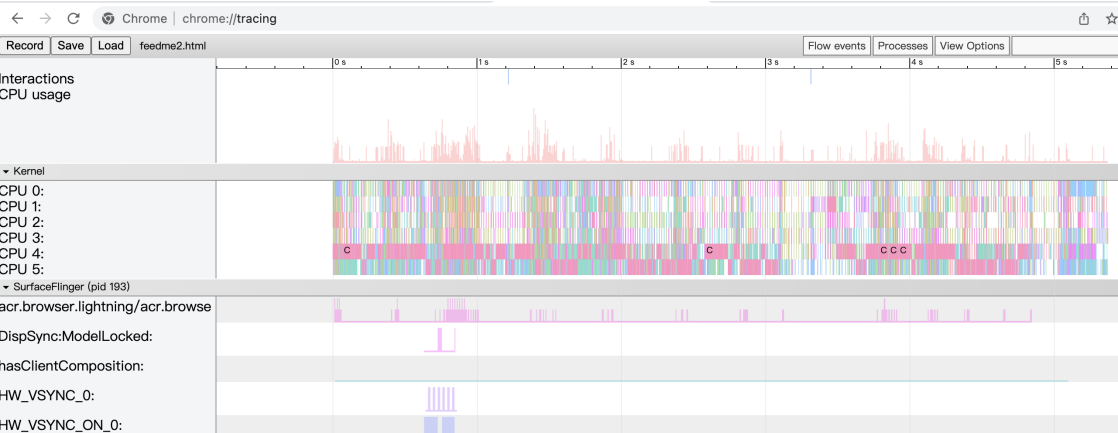
The source does not describe the Android Systrace UI in detail, noting that many explanations are available online.
6. Appendix
6.1 atrace.h
#ifndef __ATRACE_H__
#define __ATRACE_H__

#define ATRACE_TAG   1

#include "trace.h"
#include <stdint.h>

// See <cutils/trace.h> for more ATRACE_* macros.

// ATRACE_NAME traces from its location until the end of its enclosing scope.
#define _PASTE(x, y) x ## y
#define PASTE(x, y) _PASTE(x,y)
#define ATRACE_NAME(name) ScopedTrace PASTE(___tracer, __LINE__)(ATRACE_TAG, name)

// ATRACE_CALL is an ATRACE_NAME that uses the current function name.
#define ATRACE_CALL() ATRACE_NAME(__FUNCTION__)

static inline void atrace_begin(__attribute__((unused)) uint64_t tag, const char*
name)
{
    atrace_begin_body(name);
}

static inline void atrace_end(__attribute__((unused)) uint64_t tag)
{
    atrace_end_body();
}

class ScopedTrace {
public:
    inline ScopedTrace(uint64_t tag, const char* name) : mTag(tag) {
        atrace_begin(mTag, name);
    }

    inline ~ScopedTrace() {
        atrace_end(mTag);
    }

private:
    uint64_t mTag;
};

#endif // __ATRACE_H__
6.2 trace.h
#ifndef __TRACE_H__
#define __TRACE_H__

#include <stdint.h>

#if defined(__cplusplus)
#define __BEGIN_DECLS extern "C" {
#define __END_DECLS }
#else
#define __BEGIN_DECLS
#define __END_DECLS
#endif

__BEGIN_DECLS

void atrace_begin_body(const char* name);
void atrace_end_body();
void atrace_async_begin_body(const char* name, int32_t cookie);
void atrace_async_end_body(const char* name, int32_t cookie);
void atrace_int_body(const char* name, int32_t value);
void atrace_int64_body(const char* name, int64_t value);

__END_DECLS

#endif
6.3 trace.c
#include "trace.h"
#include <sys/types.h>
#include <sys/stat.h>
#include <fcntl.h>
#include <unistd.h>
#include <stdlib.h>
#include <stdio.h>
#include <errno.h>
#include <inttypes.h>
#include <string.h>

//#define TRACE_ON

#ifdef TRACE_ON

#ifdef __cplusplus
#define CC_LIKELY( exp )    (__builtin_expect( !!(exp), true ))
#define CC_UNLIKELY( exp )  (__builtin_expect( !!(exp), false ))
#else
#define CC_LIKELY( exp )    (__builtin_expect( !!(exp), 1 ))
#define CC_UNLIKELY( exp )  (__builtin_expect( !!(exp), 0 ))
#endif

#define ATRACE_MESSAGE_LENGTH 1024

static int atrace_marker_fd     = -1;
static int init_ok = 0;

static int trace_init_once(void)
{
    if (init_ok == 0)
    {
         atrace_marker_fd = open("/sys/kernel/debug/tracing/trace_marker",
O_WRONLY | O_CLOEXEC);
        if (atrace_marker_fd == -1) {
            printf("Error opening trace file: %s (%d)\n", strerror(errno),
errno);
            return -1;
        }
    }

    init_ok = 1;
    return 0;
}

#define WRITE_MSG(format_begin, format_end, name, value) { \
    char buf[ATRACE_MESSAGE_LENGTH]; \
    if (CC_UNLIKELY(!init_ok)) \
        trace_init_once(); \
    int pid = getpid(); \
    int len = snprintf(buf, sizeof(buf), format_begin "%s" format_end, pid, \
        name, value); \
    if (len >= (int) sizeof(buf)) { \
        /* Given the sizeof(buf), and all of the current format buffers, \
         * it is impossible for name_len to be < 0 if len >= sizeof(buf). */ \
        int name_len = strlen(name) - (len - sizeof(buf)) - 1; \
        /* Truncate the name to make the message fit. */ \
        printf("Truncated name in %s: %s\n", __FUNCTION__, name); \
        len = snprintf(buf, sizeof(buf), format_begin "%.*s" format_end, pid, \
            name_len, name, value); \
    } \
    write(atrace_marker_fd, buf, len); \
}

void atrace_begin_body(const char* name)
{
    WRITE_MSG("B|%d|", "%s", name, "");
}

void atrace_end_body()
{
    WRITE_MSG("E|%d", "%s", "", "");
}

void atrace_async_begin_body(const char* name, int32_t cookie)
{
    WRITE_MSG("S|%d|", "|%" PRId32, name, cookie);
}

void atrace_async_end_body(const char* name, int32_t cookie)
{
    WRITE_MSG("F|%d|", "|%" PRId32, name, cookie);
}

void atrace_int_body(const char* name, int32_t value)
{
    WRITE_MSG("C|%d|", "|%" PRId32, name, value);
}

void atrace_int64_body(const char* name, int64_t value)
{
    WRITE_MSG("C|%d|", "|%" PRId64, name, value);
}

#else

void atrace_begin_body(__attribute__((unused)) const char* name)
{
}

void atrace_end_body()
{
}

void atrace_async_begin_body(__attribute__((unused)) const char* name,
__attribute__((unused)) int32_t cookie)
{
}

void atrace_async_end_body(__attribute__((unused)) const char* name,
__attribute__((unused)) int32_t cookie)
{
}

void atrace_int_body(__attribute__((unused)) const char* name,
__attribute__((unused)) int32_t value)
{
}
void atrace_int64_body(__attribute__((unused)) const char* name,
__attribute__((unused)) int64_t value)
{
}

#endif